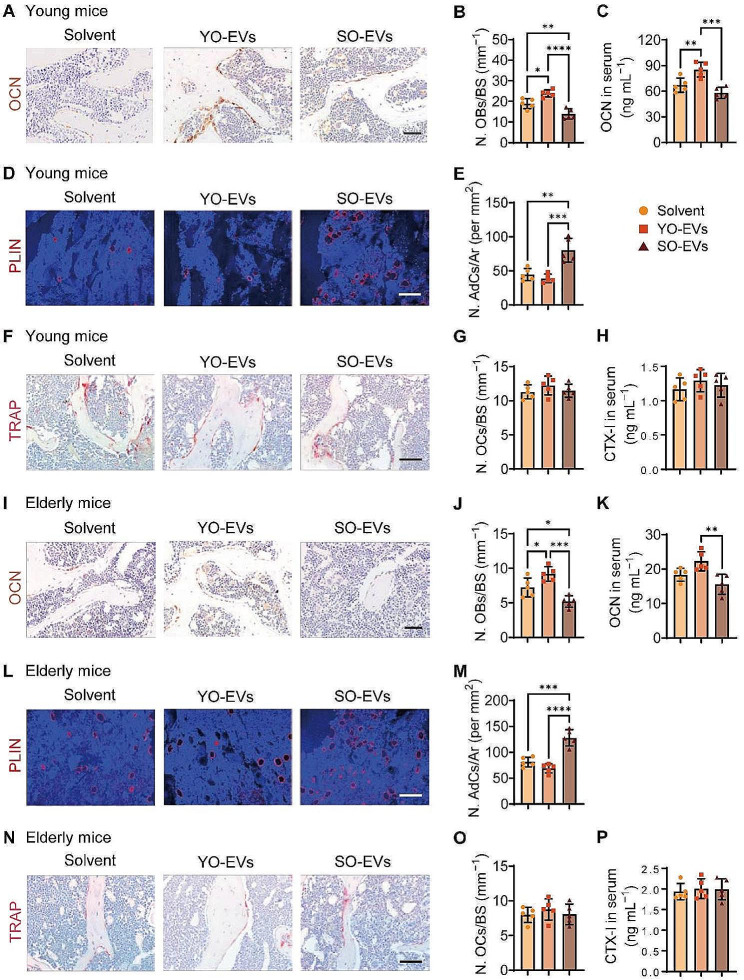
Fig. 4.
Enhancement of bone formation by YO-EVs and promotion of fat accumulation by SO-EVs in bone marrow. OCN immunohistochemical staining images (A for young mice; I for elderly mice), the number of OCN+ (brown) osteoblasts (N. OBs) on the trabecular bone surface (B for young mice; J for elderly mice), and the concentration of OCN in serum (C for young mice; K for elderly mice). PLIN immunofluorescence staining images (D for young mice; L for elderly mice), the number of PLIN+ (red) adipocytes in bone marrow (N. AdCs per mm2; E for young mice; M for elderly mice). TRAP histochemical staining images (F for young mice; N for elderly mice), the number of TRAP+ (red) osteoclasts (N. OCs) on the trabecular bone surface (G for young mice; O for elderly mice), and the concentration of CTX-I in serum (H for young mice; P for elderly mice). Scale bar: 50 μm (in A, F, I, and N) or 100 μm (in D and L). n = 5 per group. BS: bone surface, Ar: area. PBS treatment was used in the solvent groups. * P < 0.05, ** P < 0.01, *** P < 0.001, **** P < 0.0001

