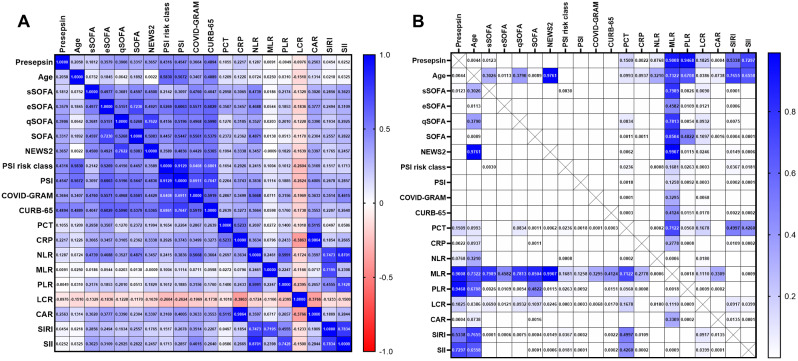
Fig. 3.
Heatmap showing the correlation between Presepsin and age, clinical scores, and inflammation markers. (A) The values are presented as Spearman‘s correlation coefficient (r) for a sample of 190 runners regarding Presepsin. The colormap ranges from 1 to -1, with blue indicating the highest value and red indicating the lowest value. (B) The Heatmap of corresponding p-values.The colormap ranges from 0 to 1, with blue representing the largest value and white representing the smallest value. White cells without numerical values indicate that the p-value is smaller than 0.0001, indicating a highly significant correlation. Abbreviations s, e, q SOFA, simplified, early, quick sequential organ failure assessment; NEWS2, National Early Warning Score 2; PSI, Pneumonia Severity Index; PCT, Procalcitonin; CRP, C-reactive protein; NLR, Neutrophil-to-lymphocyte ratio; MLR, Monocyte-to-lymphocyte ratio; PLR, Platelet-to-lymphocyte ratio; LCR, Lymphocyte-to-C-reactive protein ratio; CAR, C-reactive protein-to-albumin ratio; SIRI, Systemic inflammation response index; SII: Systemic inflammation index. SIRI = (Neutrophil count × Monocyte count) / Lymphocyte count; SII = (Neutrophil count × Platelet count) / Lymphocyte count

