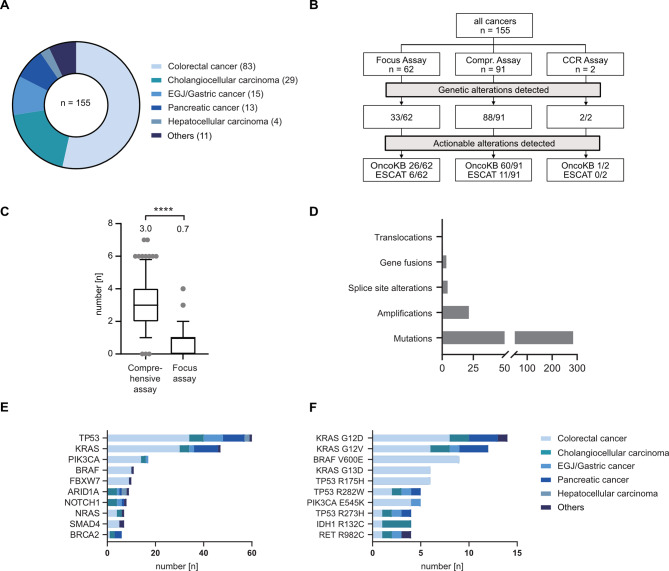
Fig. 1.
Spectrum of cancer mutations detected by panel gene sequencing. (A) Pie chart showing distribution of cancer entities in panel gene sequencing cohort. (B) Flowchart showing distribution of assay types, and the fraction of assays that detected genetic alterations or actionable alterations. Actionability of genetic alterations were either classified using the OncoKB database (“OncoKB”) or the ESMO guidelines (“ESCAT”). (C) Frequency of detected mutations between assay types are shown as box plots with whiskers indicating 10/90 percentiles. The mean number of genetic alterations per assay is shown above the box plots. Statistical testing was done using a Wilcoxon-rank sum test. **** indicates p < 0.001. (D) Bar chart showing distribution of different genetic alterations in the cohort. (E-F) Bar chart showing the ten most frequently altered genes (E) and the most frequent genetic alterations (F). Abbreviations: CCR– Childhood Cancer Research (Assay)

