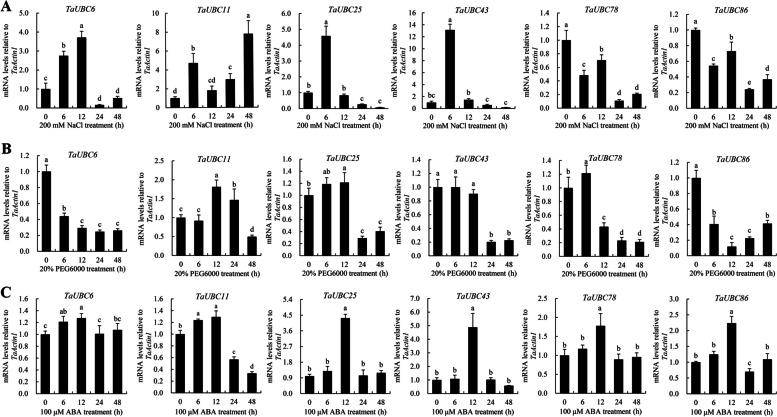
Fig. 4.
qRT-PCR analysis of selected TaUBCs under 200 mM NaCl, 20% PEG6000, and 100 uM ABA stress. A Relative expression patterns of TaUBCs in leaves after 200 mM NaCl treatment. B Relative expression patterns of TaUBCs in leaves after 20% PEG6000 treatment. C Relative expression patterns of TaUBCs in leaves after treatment with 100 uM ABA. Relative expression values in the control sample (CK 0 h) were normalized to 1. TaActin1 was used as a reference gene. Each bar value is the average value ± standard deviation based on three biological replicates. The different letters denote a significant difference between means (P < 0.05)

