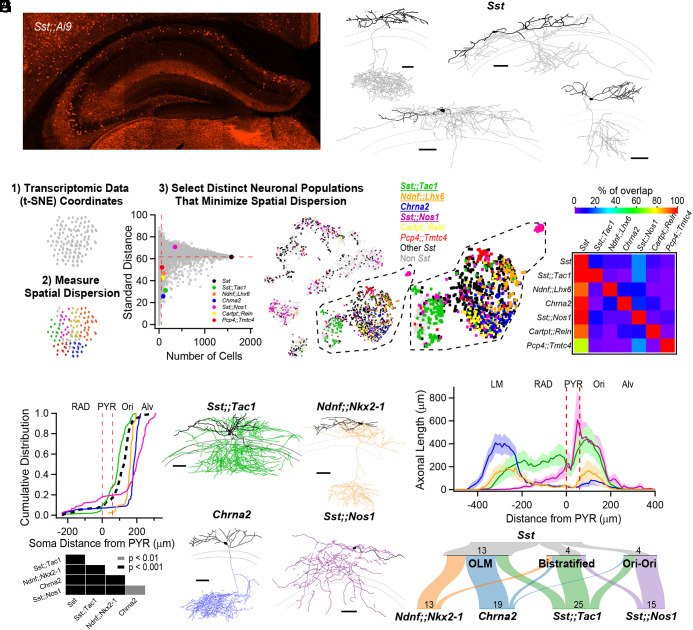
Fig. 1.
Anatomical heterogeneity of hippocampal Sst-INs is partly solved by linking genetic identity to function. (A) Confocal image from an Sst;;Ai9 mouse brain microsection showing the distribution of hippocampal neurons expressing the fluorescent protein TdTomato. In the CA1 region, Sst-INs are mostly found in stratum oriens/alveus (O/A). (B) Neurolucida reconstructions of CA1 O/A INs recorded in the Sst;;Ai9 mouse model and filled with biocytin. Individual examples selected to highlight the diversity of axonal projections from these neurons (dendrites in black, axon in gray). Calibration bars = 100 μm. (C) Strategy to identify genes or pairs of genes delineating clusters of neurons that tile the larger Sst-IN population in the Harris et al. dataset (Materials and Methods). (D) Selection of gene pairs to generate intersectional transgenic mouse models (bold and underlined), and pairs of genes which could potentially label specific subpopulations for which mice were not generated. The gene Chrna2 by itself fulfills the established criteria and enabled the use of a pre-existing transgenic mouse line (11). All residual cells expressing a nonzero level of Sst transcripts are shown in black, and all other cells are shown in light gray. (E) Matrix showing little overlap of subsets of neurons expressing the selected combination of genes. Two potential gene pairs additionally identified within the Harris dataset are shown. Percentage of overlap color coded, where red represents 100% overlap and violet represents 0% overlap. Percentages normalized relative to diagonal (100%). (F) Quantification of the localization of fluorescently labeled cell bodies in the five genotypes relative to the PYR layer in the CA1 hippocampus. Table below reports the P-values from KS tests between the five genotypes after Holm–Bonferroni correction for multiple comparisons. (G) Neurolucida reconstructions of representative interneurons visually targeted for recording by the expression of a fluorescent reporter in the different transgenic mouse models. Individual neurons were recorded and filled with biocytin (axons colored according to genotype, dendrites in black). Calibration bars, 100 μm. (H) Histogram of axonal distribution for all interneurons recorded and filled in the four transgenic mouse models as a function of distance from the pyramidal cell layer (indicated by the dashed red lines). The shaded areas correspond to the SE. (I) Sankey diagrams showing the segregation of Sst-INs into three broadly defined anatomical categories, OLM, bistratified and oriens-oriens (Top); the genetically identified subclasses (Bottom) capture and tile the three general anatomical categories of Sst-INs, and further refine the within-genotype anatomical identity. Number of reconstructed neurons is shown.

