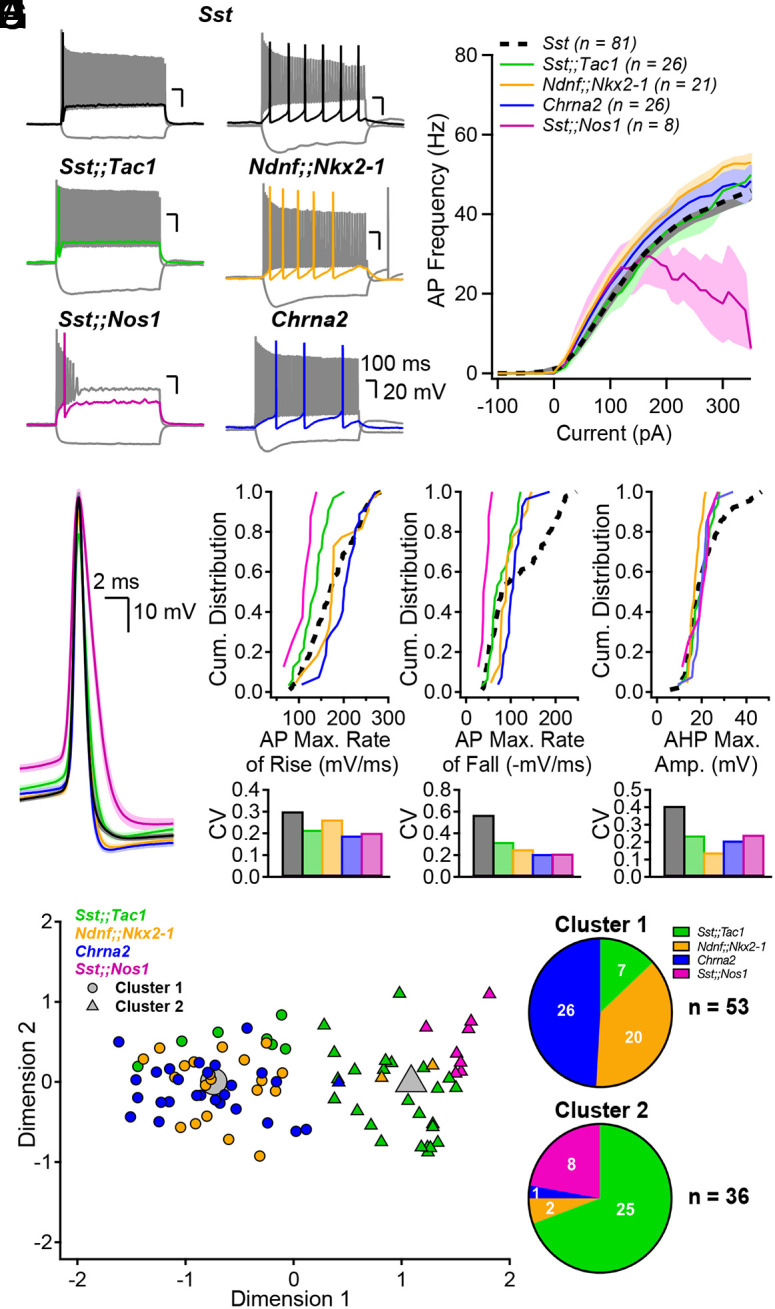
Fig. 2.

Genetically defined subpopulations of Sst-INs tile the electrophysiological parameter space and account for the heterogeneity within the Sst family. (A) Membrane potential changes resulting from hyperpolarizing and depolarizing current pulses in the five transgenic mouse models indicated. Each panel includes a response to hyperpolarizing pulse driving Vm between −100 and −90 mV, a response to rheobase current pulse (color), and the maximal firing rate response (gray). (B) Firing frequency as a function of current injection amplitude. Number of averaged cells is shown. (C) Action potential waveforms elicited by rheobase current, aligned at peak overshoot, averaged across all interneurons in each subgroup. Shaded areas correspond to SE. (D) Top, Cumulative distribution of the AP maximal rate of rise (mV/ms) for the five genotypes and associated coefficients of variation (CV, Bottom). (E and F) Same as (D) but for the AP maximal rate of fall (E) and the AP afterhyperpolarization maximal amplitude (F). (G) Principal component analysis followed by unsupervised K-means clustering analysis using the electrophysiological parameters above and in SI Appendix, Fig. S9 divides the neurons into two clusters. (H) Pie charts summarizing the distribution of the genetically identified interneuron subgroups across electrophysiologically defined clusters. The distribution of neurons was significantly different than expected by chance (Chi-square = 54.751, P < 0.0001).
