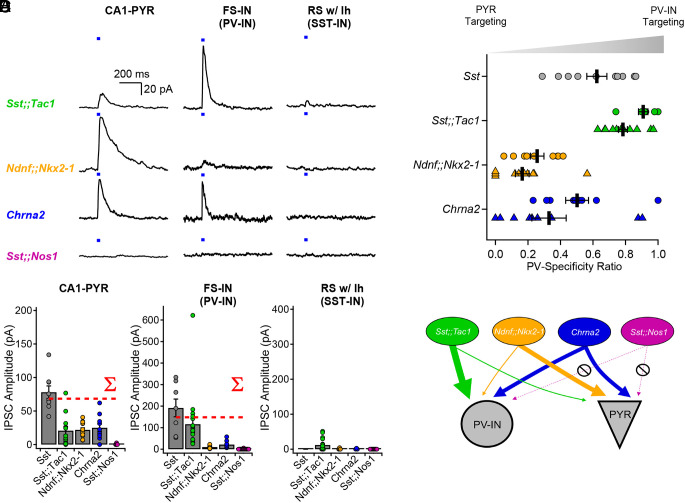
Fig. 3.
Optogenetic circuit mapping reveals that postsynaptic targets of Sst-INs are subpopulation-specific. (A) Voltage-clamp recordings (holding potential = 0 mV) from pyramidal cells, fast-spiking interneurons, and regular-spiking interneurons with prominent sag, showing representative IPSCs generated by optogenetic activation of IN subpopulations. (B) Summary bar graph of IPSC amplitudes recorded in the three target types. The dotted red lines show the arithmetic sums of IPSCs generated by photostimulation of the individual subpopulations. Data for Sst-INs photostimulation recorded in FS-INs partly replotted from Chamberland et al. (21) (Fig. 2J). (C) Sequential recordings from neighboring fast-spiking interneurons and pyramidal cells reveals target-specificity of Sst;;Tac1-INs, Ndnf;;Nkx2-1-INs, and Chrna2-INs. Circles show sequential recordings performed with K+ internal solution and triangles show sequential recording performed with Cs+ internal solution. (D) Cartoon depicting the target selectivity of Sst-IN subpopulations. Average ± SEM is shown.

