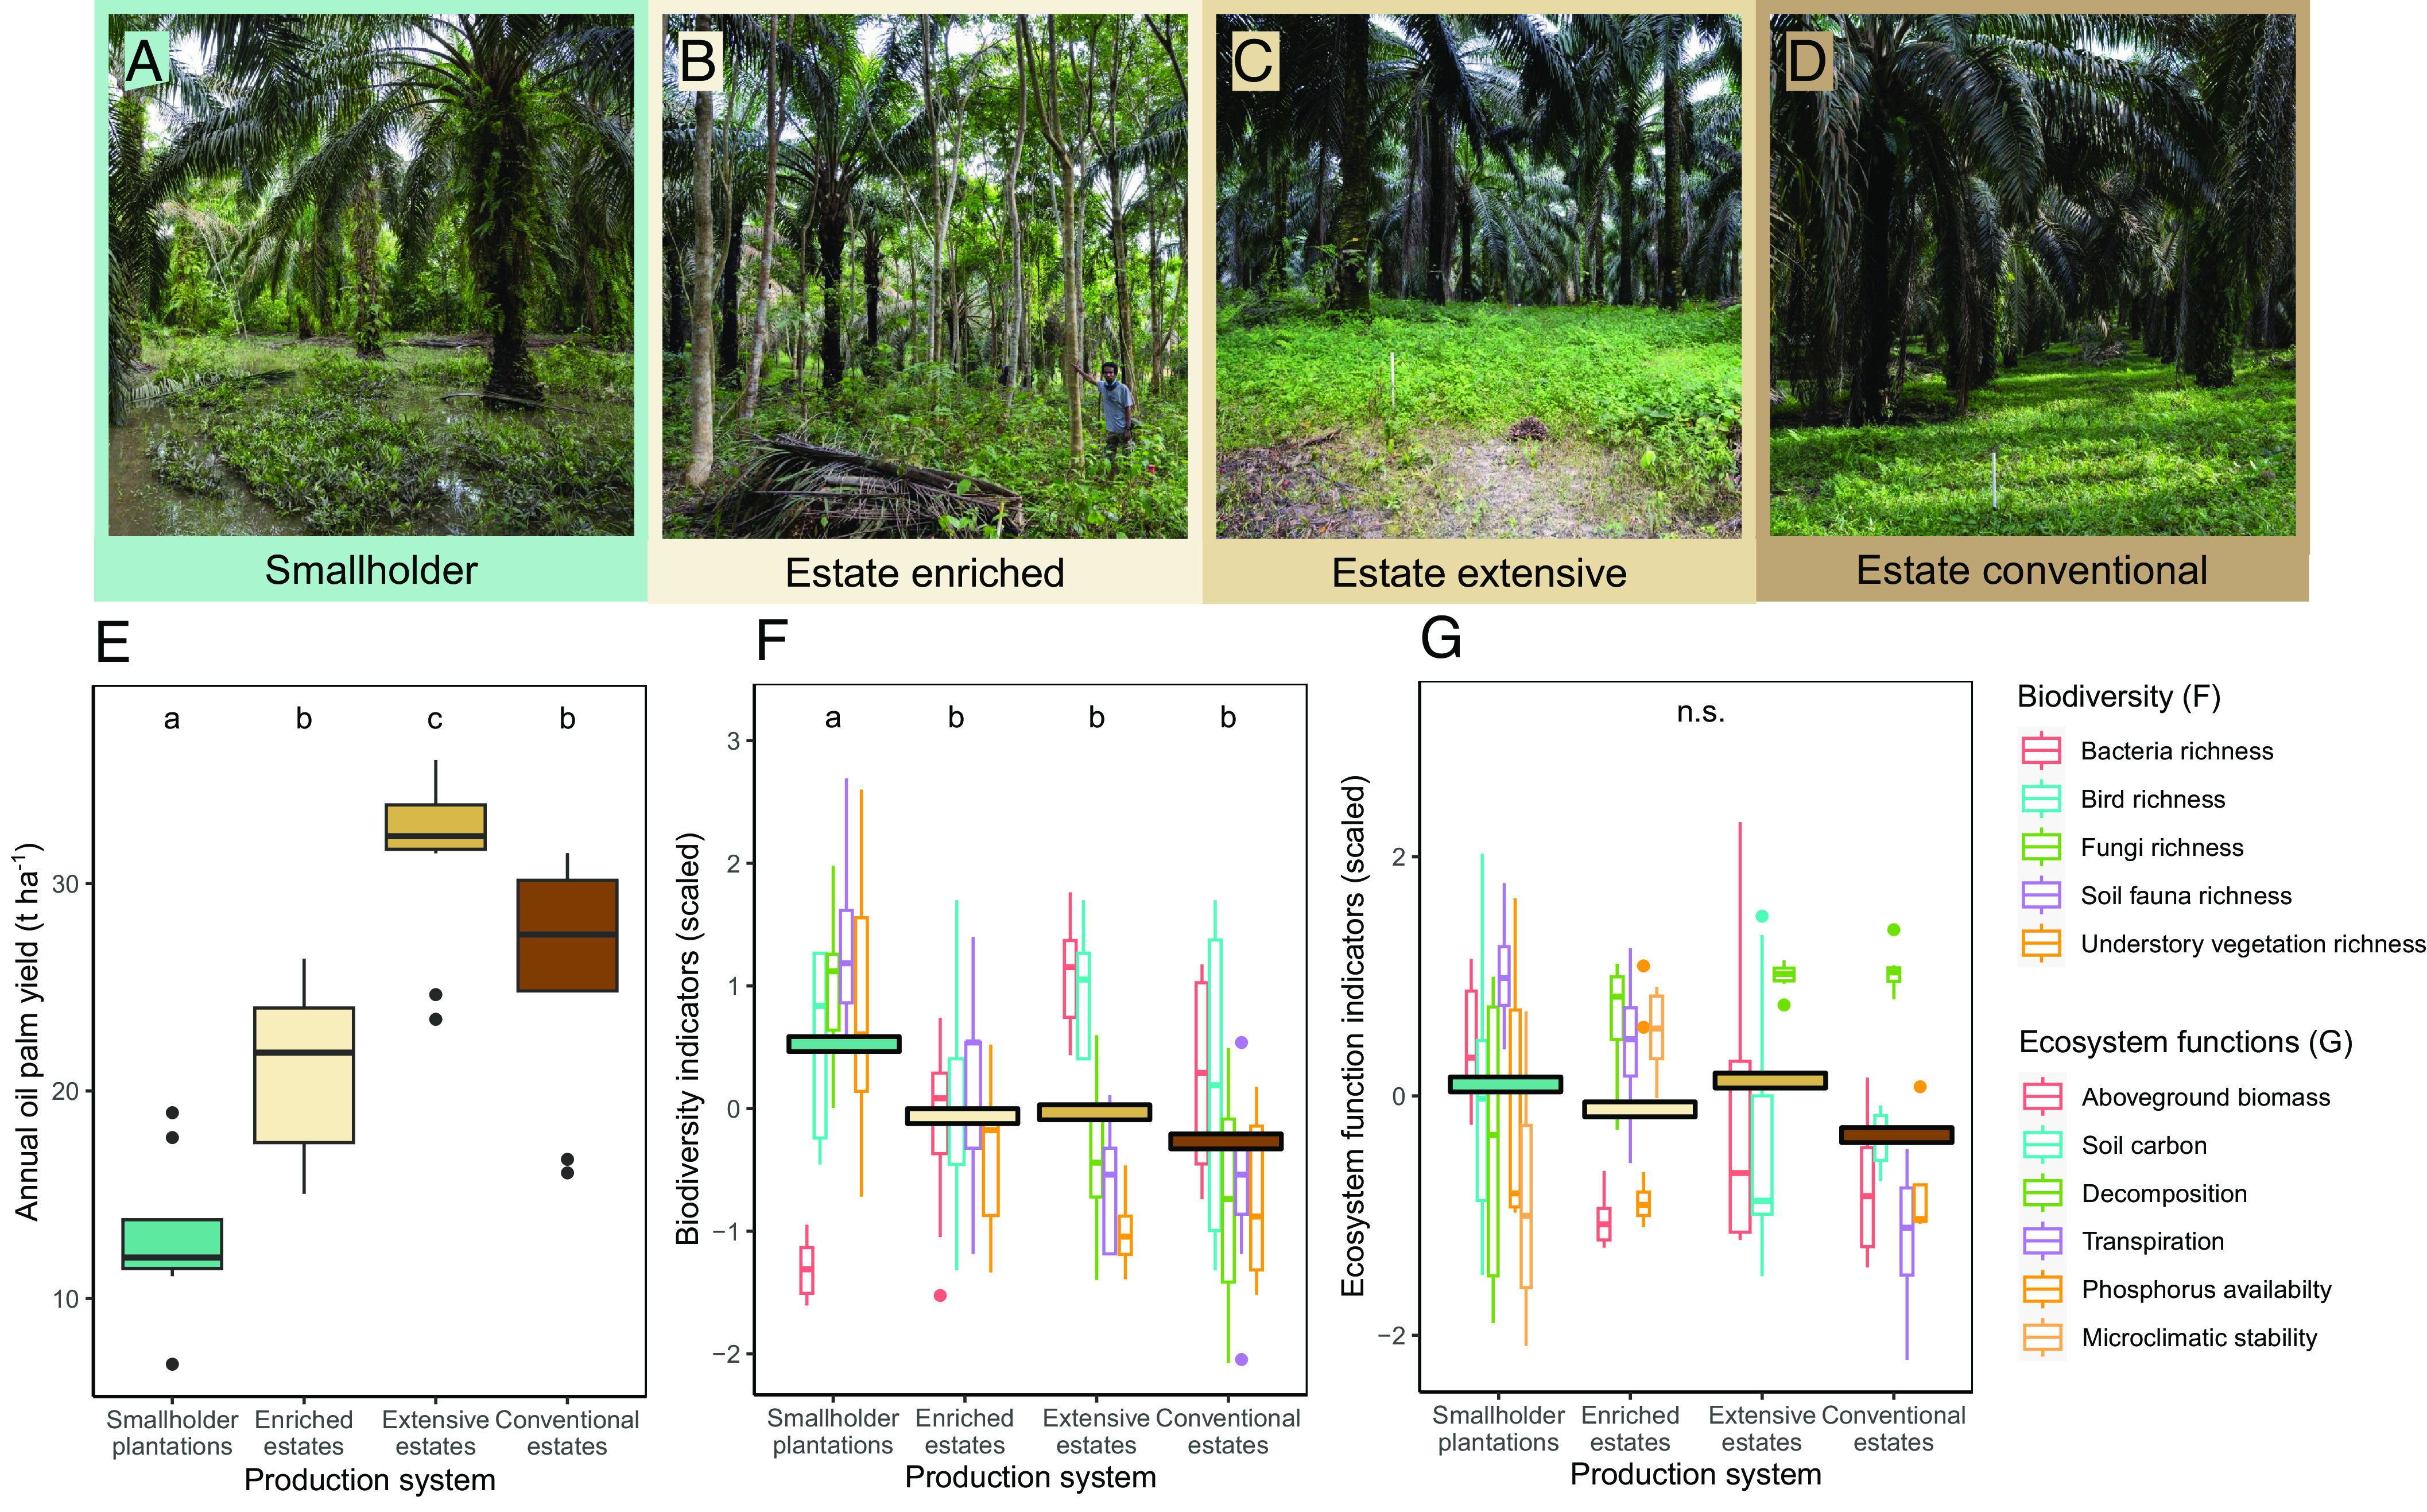
Fig. 1.

Oil palm production systems considered in this study: smallholder plantations (A), estates enriched with trees (B), estates with extensive management (C) and conventionally managed estates (D). Boxplots of mean annual palm oil yields per hectare for each system (E), boxplots of standardized biodiversity indicators (F), and ecosystem function indicators per cultivation system (G). Boxplots represent the median (bars), the 25 to 75% intervals (box edges) and the 1.5 interquartile range (whiskers) of the raw data (n = 355). Boxplot colors in F and G indicate ecological indicator identity. Colored horizontal bars represent the mean indicator scores per system. Distinct letter combinations indicate significant differences between systems assessed through linear models with production system identity as the only predictor (Tukey test, P < 0.05).
