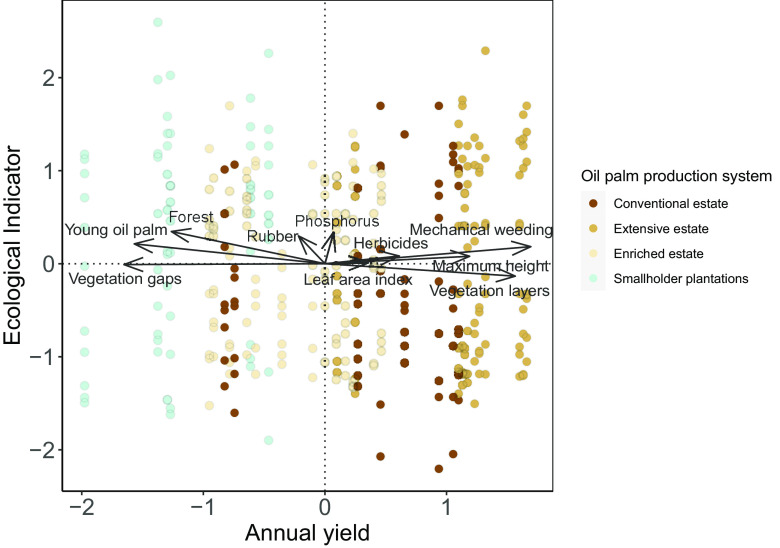
Fig. 3.
Variation in ecological indicators of biodiversity/ecosystem functions and oil palm yield across the studied oil palm systems. Each point shows a plot-level yield—biodiversity/ecosystem function combination. Scaled values for all indicators included in the dataset are shown. Colors indicate oil palm production systems. Arrows indicate plot-level structural complexity, management, and landscape variables that significantly (P < 0.05) explain the two-dimensional variation in biodiversity/functions and yield. Arrow tips indicate the direction of steepest increase. Dotted lines separate win–win situations (i.e., Top-Right Quadrant) from trade-offs (Top-Left, Lower-Right) and lose-lose situations (Lower-Left). Considered variables are: Management variables: Phosphorus inputs, herbicide weeding intensity, mechanical weeding intensity, LiDAR metrics: Maximum canopy height, number of gaps, vegetation layer (structural complexity, “enl”); Landscape variables: Forest, rubber and young oil palm cover in a 1 km radius around site.

