
Fig. 3.
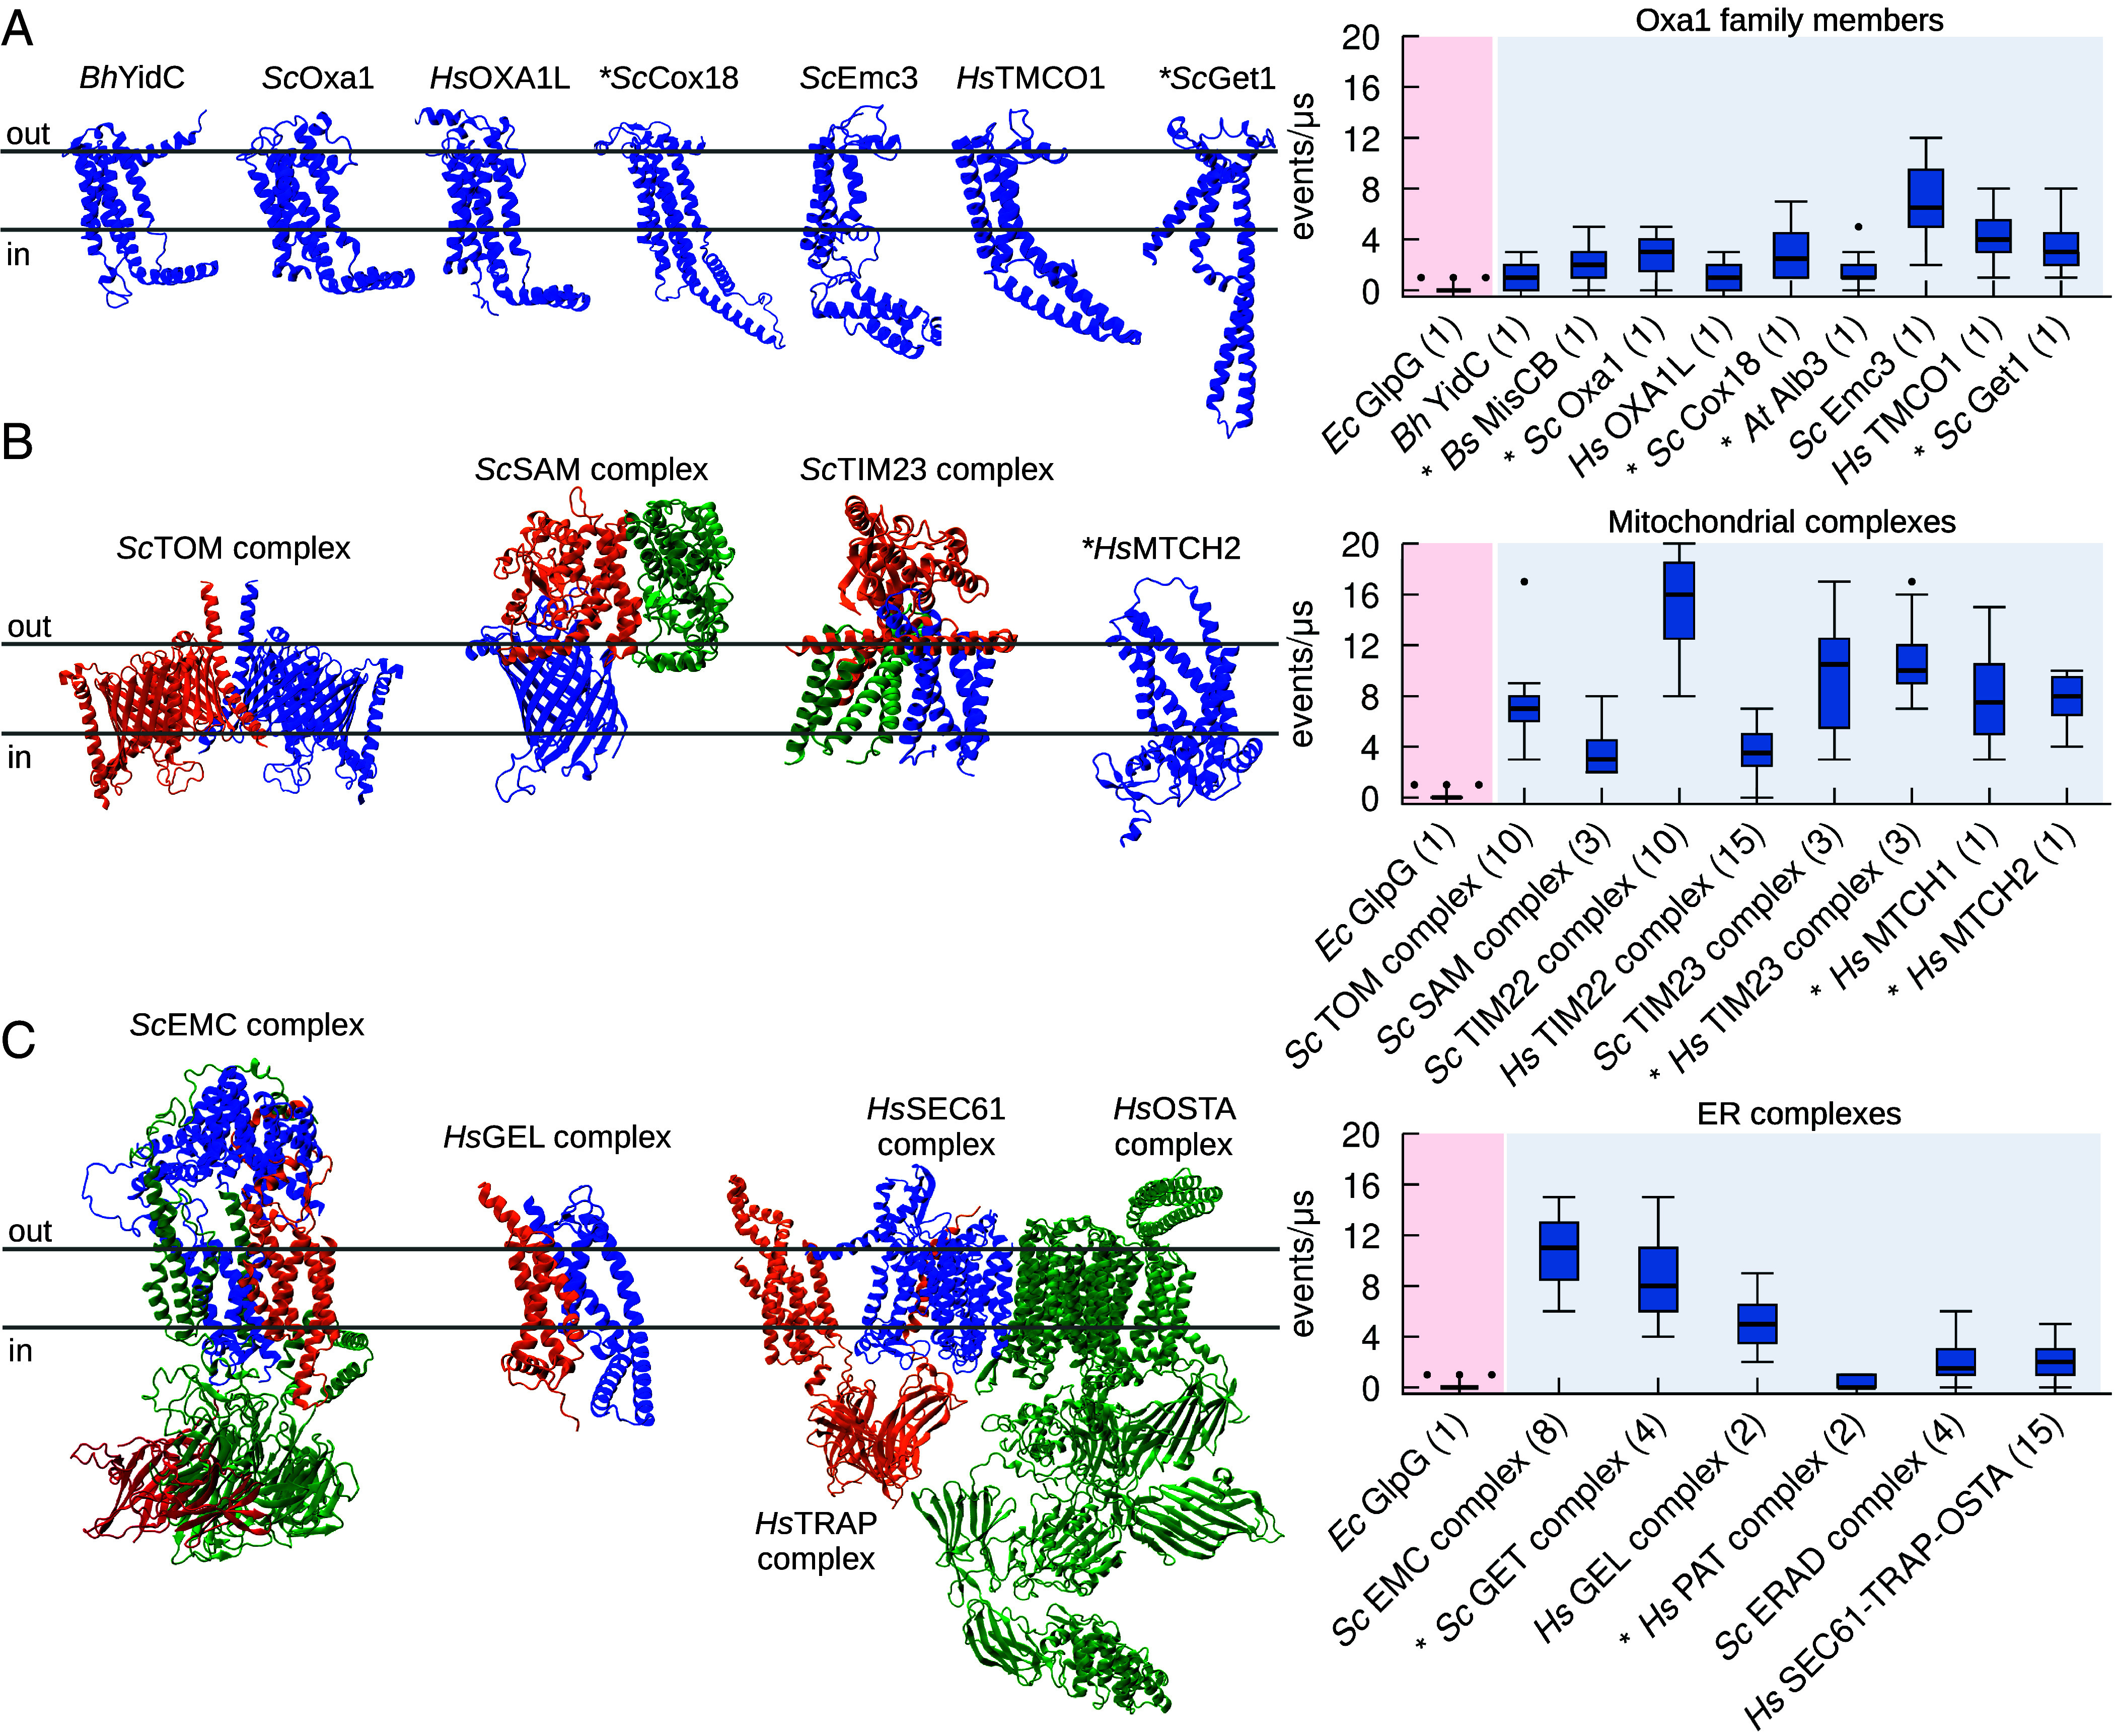
CG-MD simulations identify protein insertase complexes as lipid scramblases. (A) All members of the Oxa1 family of insertases have in silico lipid scrambling activity in their monomeric form. Left: 3D structure of selected members of the Oxa1 family. Right: In silico lipid scrambling quantification. The negative control EcGlpG is shown as reference. (B) Mitochondrial insertase complexes have in silico lipid scrambling activity. Left: 3D structure of selected mitochondrial insertase complexes. Right: In silico lipid scrambling quantification. (C) ER insertase complexes have in silico lipid scrambling activity. Left: 3D structure of selected ER insertase complexes. Right: In silico lipid scrambling quantification. AlphaFold structures are denoted by the * symbol, number of proteins in the complex is in parenthesis.