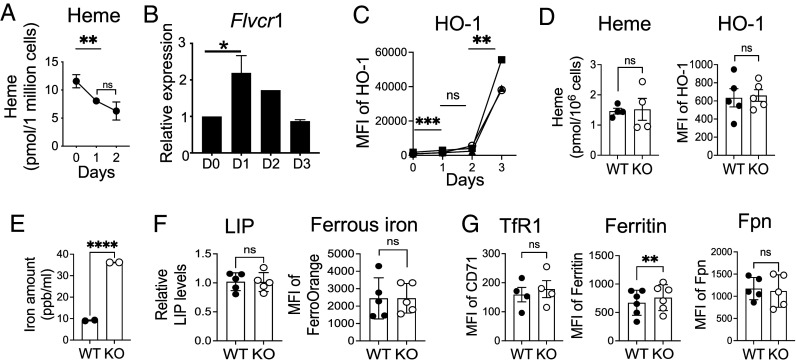
Fig. 1.
Increased intracellular iron in FLVCR1 KO naive CD4 T cells. (A–C) Enriched naive CD4 T cells from C57BL/6 mice were activated with anti-CD3 and anti-CD28 antibodies as described in Materials and Methods. (A) Total cell lysate at indicated time points after stimulation and unstimulated (D0) cells were used to measure intracellular heme levels (n = 3). (B) RNA was isolated from naive CD4 T cells at indicated time points and used for gene expression analysis using qPCR. A bar graph represents the relative gene expression of FLVCR1 (n = 3). (C) HO-1 protein expression was measured by flow cytometry, and the mean fluorescence intensity (MFI) was shown (n = 3). (D and E) Naive CD4 T cells from WT and KO mice were sorted and analyzed for the indicated parameters. (D) Graphs show the heme (Left) and HO-1 levels (Right) in naive CD4 T cells (n = 4 to 5). (E) Total cell lysate was prepared from naive CD4 T cells and subjected to ICP-MS analysis. The graph shows the total iron level (reported in parts per billion per 1 × 10⁶ cells) (n = 2). (F and G) Naive CD4 T cells (CD62LhiCD44lo) in total splenocytes were analyzed for the indicated parameters. (F) Graphs show the LIP measured using Calcein staining (Left) (n = 5) and ferrous iron with FerrroOrange (Right) (n = 5). (G) Levels of TfR1, ferritin, and Fpn were compared by flow cytometry. Graphs show MFI of TfR1 (n = 4), ferritin (n = 6), and Fpn (n = 5) in naive CD4 T cells. The data are the cumulative result of at least three independent experiments. Error bars represent the mean ± SEM. *P < 0.05, **P < 0.01, ****P < 0.0001, ns: not significant.

