Fig. 2.
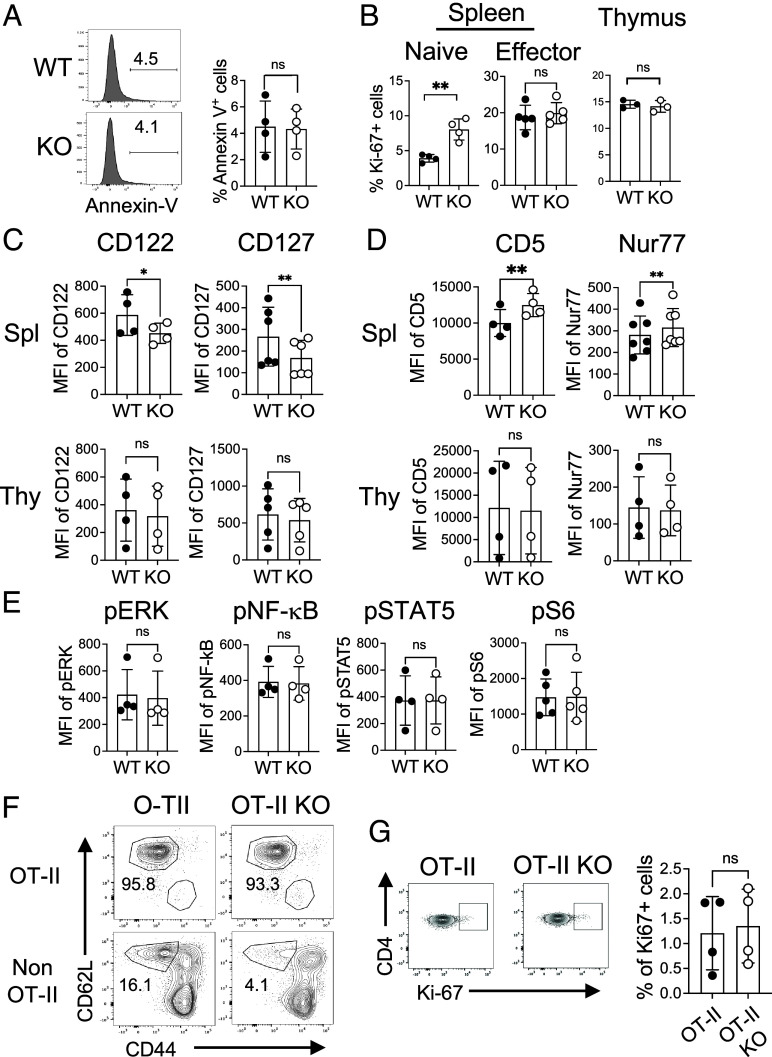
FLVCR1 deletion alters the homeostasis of naive CD4 T cells. (A) Naive CD4 T cells in total splenocytes were examined for Annexin V. The representative histograms and the bar graph show % Annexin V+ naive CD4 T cells from WT and KO mice (n = 4). (B) Graphs show percentages of Ki-67+ in splenic naive (Left), and effector CD4 T cells (Middle), and single positive CD4 T cells from the thymus (Right) (n = 3 to 5). (C and D) Graphs show the expression of IL-7Ra (CD127) and IL-15R (CD122) (C), and CD5 and Nur77 (D) in naive CD4 T cells. The Top and Bottom panels show cells from the spleens and thymus, respectively (n = 4 to 7). (E) Total splenocytes from WT and KO mice were subjected to intracellular staining for the signaling molecules pERK, pNF-kB, pSTAT5, and pS6. Graphs show the expression of these signaling molecules in naive CD4 T cells (n = 4). (F and G) Total splenocytes from OT-II and OT-II KO mice were analyzed for the distributions of naive and effector CD4 T cells. (F) The representative dot plots show the percentages of naive and effector CD4 T cells in OT-II (Va2+ Vb5+) and non-OT-II (Va2− Vb5−) CD4 T cells from OT-II and OT-II KO mice (n = 4). (G) Dot plots and the graph show percentages of Ki-67+ naive CD4 T cells in the spleen (n = 4). The data are representative of at least three independent experiments. Error bars represent the mean ± SEM. *P < 0.05, **P < 0.01, ns: not significant.

