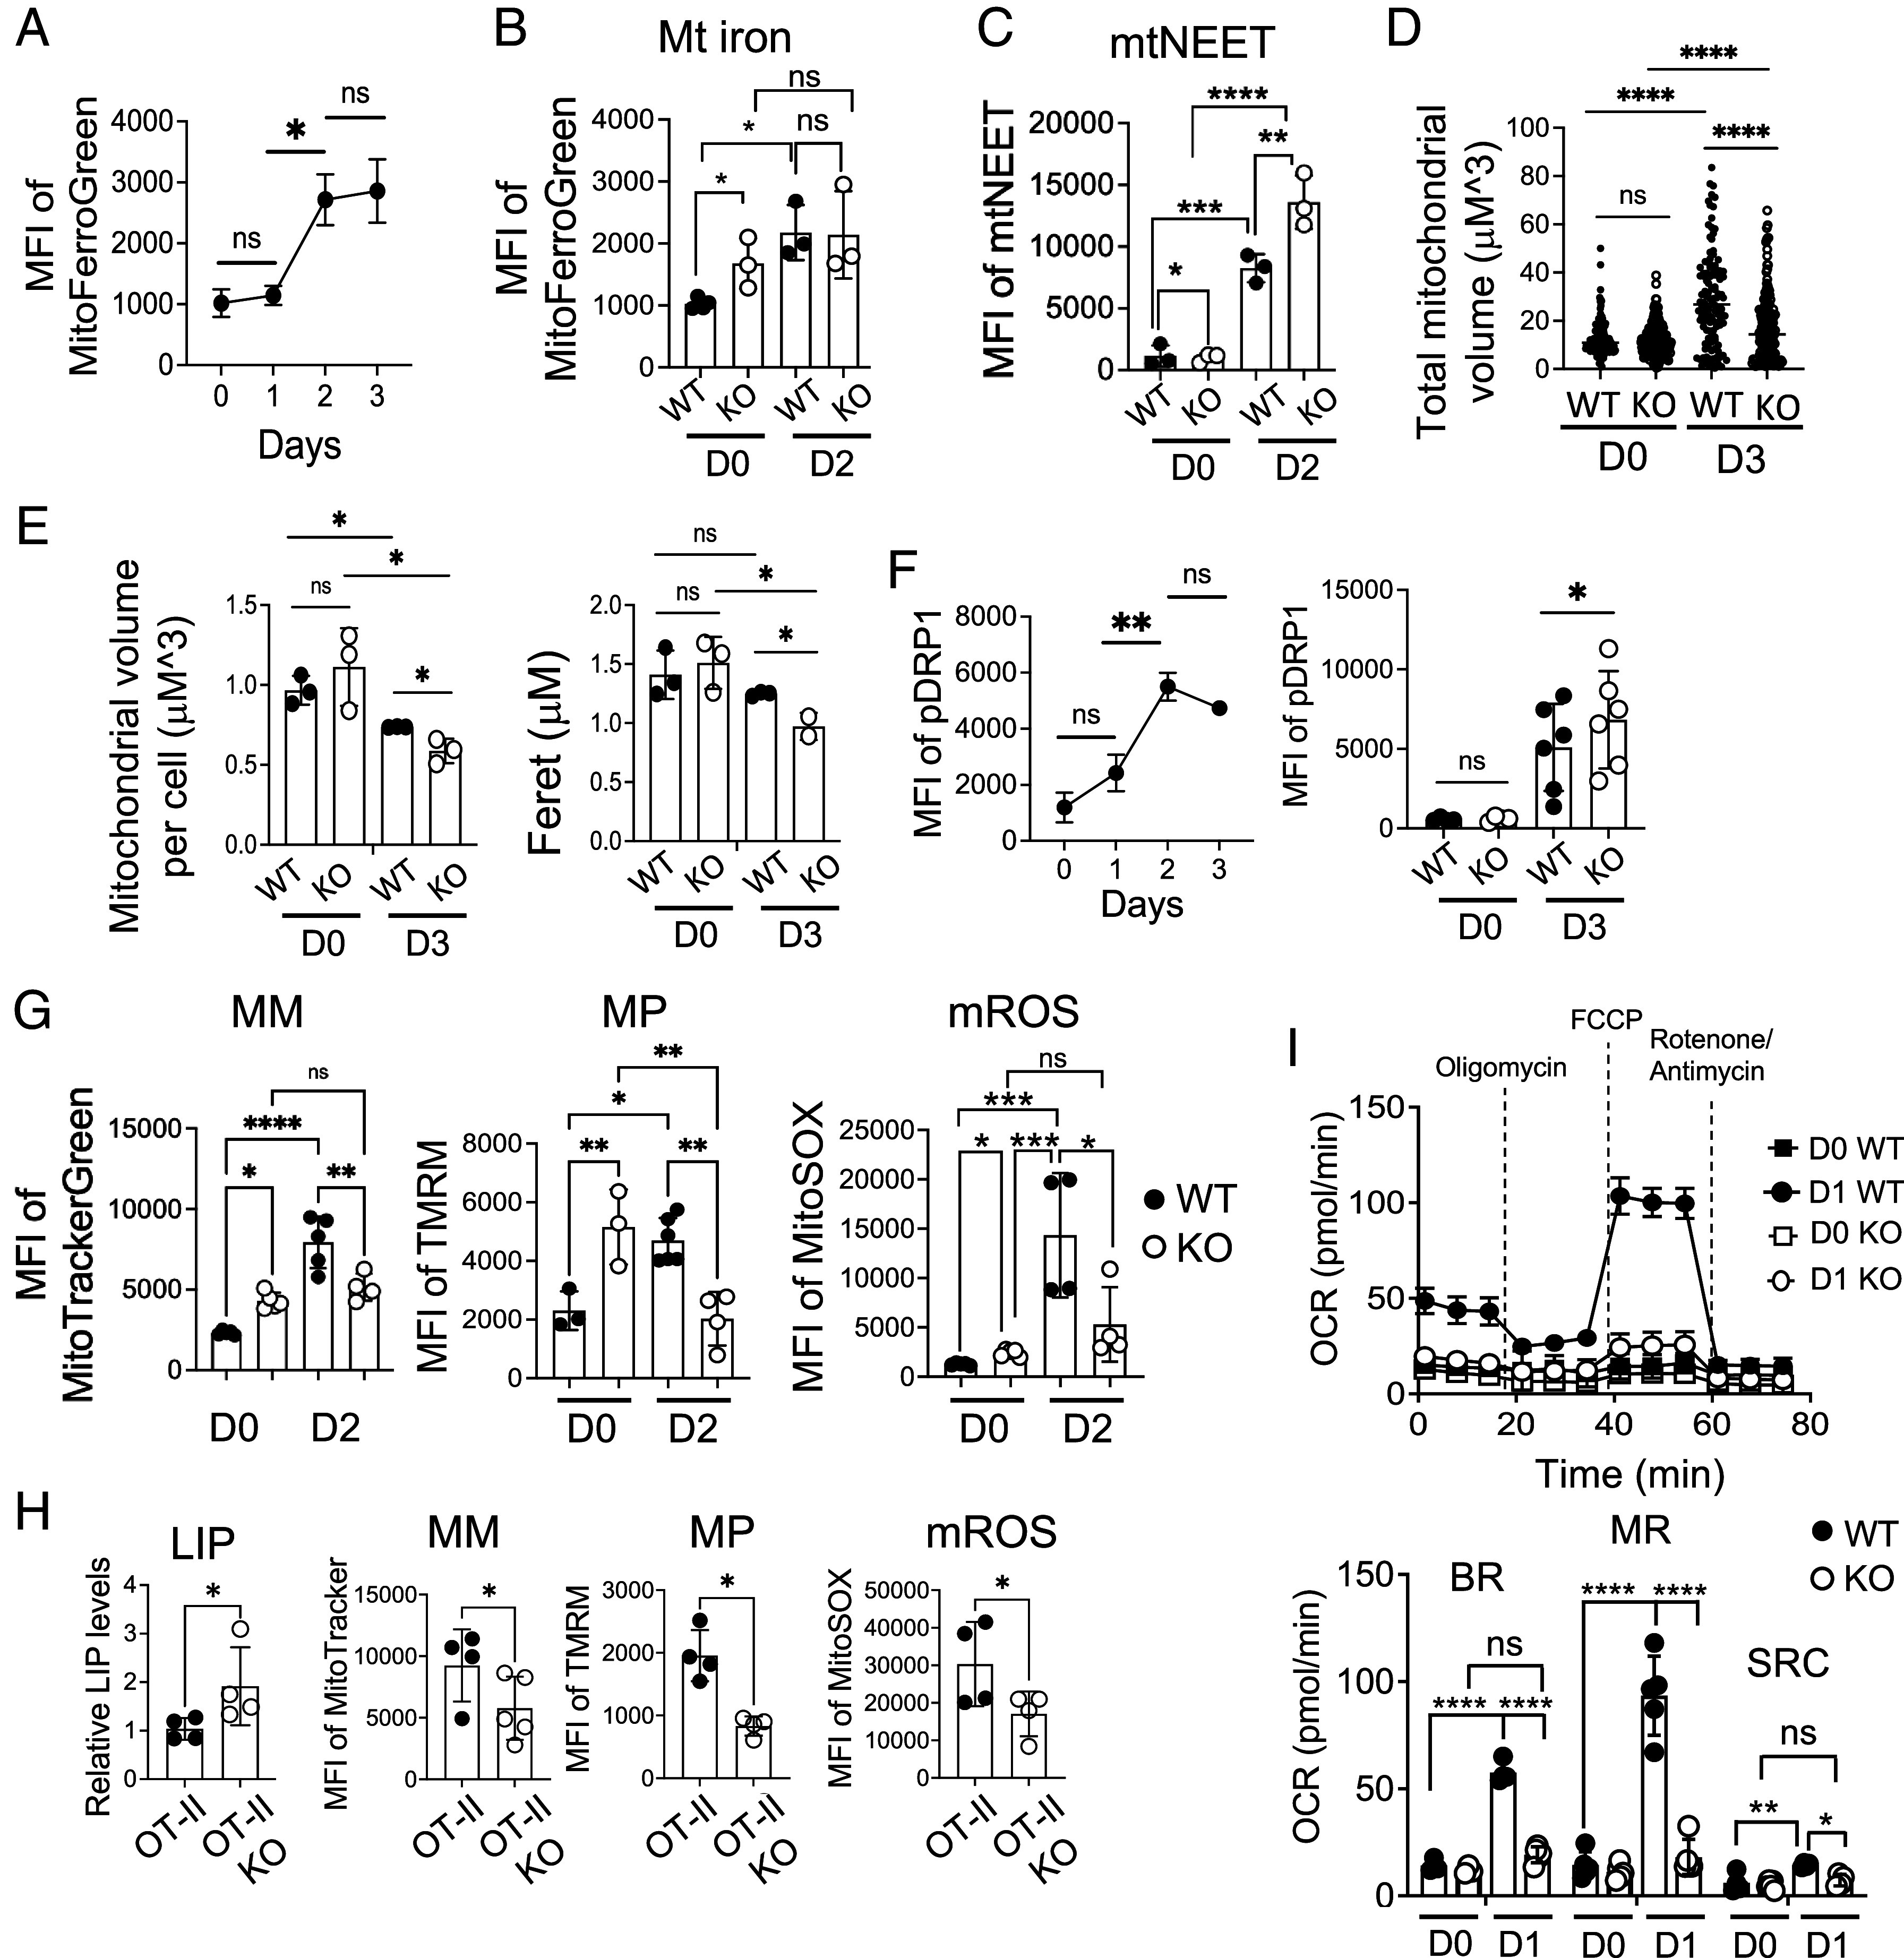
Fig. 4.

Mitochondrial fitness and function are compromised in iron-overloaded CD4 T cells. (A) Enriched naive CD4 T cells from C57BL/6 mice were activated and analyzed for mitochondrial iron levels using MFG. The graph shows the MFI of MFG over time (n = 4). (B and C) Sorted naive CD4 T cells from WT and KO mice were activated for 2 d. Graphs show mitochondrial iron (B) and the expression of mtNEET (C) from unstimulated (D0) and stimulated (D2) CD4 T cells (n = 3). (D and E) Sorted naive CD4 T cells from WT and FLVCR1 KO mice were activated for 3 d. Unstimulated (D0) and stimulated cells (D3) were subjected to ATP synthase (ATPB) staining to mark mitochondria and DAPI for nuclei, followed by visualization via the Zeiss Axio Observer with multichannel LED illumination. Analysis of the mitochondrial volume and length was performed using a custom FIJI macro script. (D) The graph shows the total volume of mitochondria of WT and KO before and after activation (n = 2 to 3). (E) Graphs show the volume (Left) and the length (Right) of mitochondria. A total number of 661 cells were examined (n = 2 to 3). (F) Enriched WT and KO naive CD4 T cells were activated and analyzed for pDrp1 expression. The Left graph shows the MFI of pDrp1 over time (n = 3). The Right graph shows pDrp1Ser616 expression in unstimulated (D0) and stimulated (D3) CD4 T cells from WT and KO mice (n = 4 to 6). (G) Sorted naive CD4 T cells from WT and FLVCR1 KO were activated for 2 d and subjected to MitoTracker, TMRM, and MitoSOX staining. The graphs show MFI values of MitoTracker, TMRM, and MitoSOX from unstimulated (D0) and stimulated cells (D2), depicting MM, MP, and mROS respectively (n = 3 to 5). (H) Enriched naive CD4 T cells from OT-II and OT-II KO mice were stimulated with dendritic cells in the presence of 100 mg/mL of Ova protein for 3 d. The graphs show LIP levels and MFI of MitoTracker green, TMRM, and MitoSOX (n = 4). (I) Naive CD4 T cells from WT and KO mice were activated for 1 d. The representative graph at the Top shows OCR using the Mito Stress Test in the Seahorse assay from unstimulated (D0) and stimulated cells (D1). The bar graph at the Bottom shows BR, maximum respiratory capacity (MRC), and reserve capacity (RC) (n = 6). The data are representative of at least three independent experiments. Error bars represent the mean ± SEM. *P < 0.05, **P < 0.01, ***P < 0.001, ****P < 0.0001, ns: not significant.
