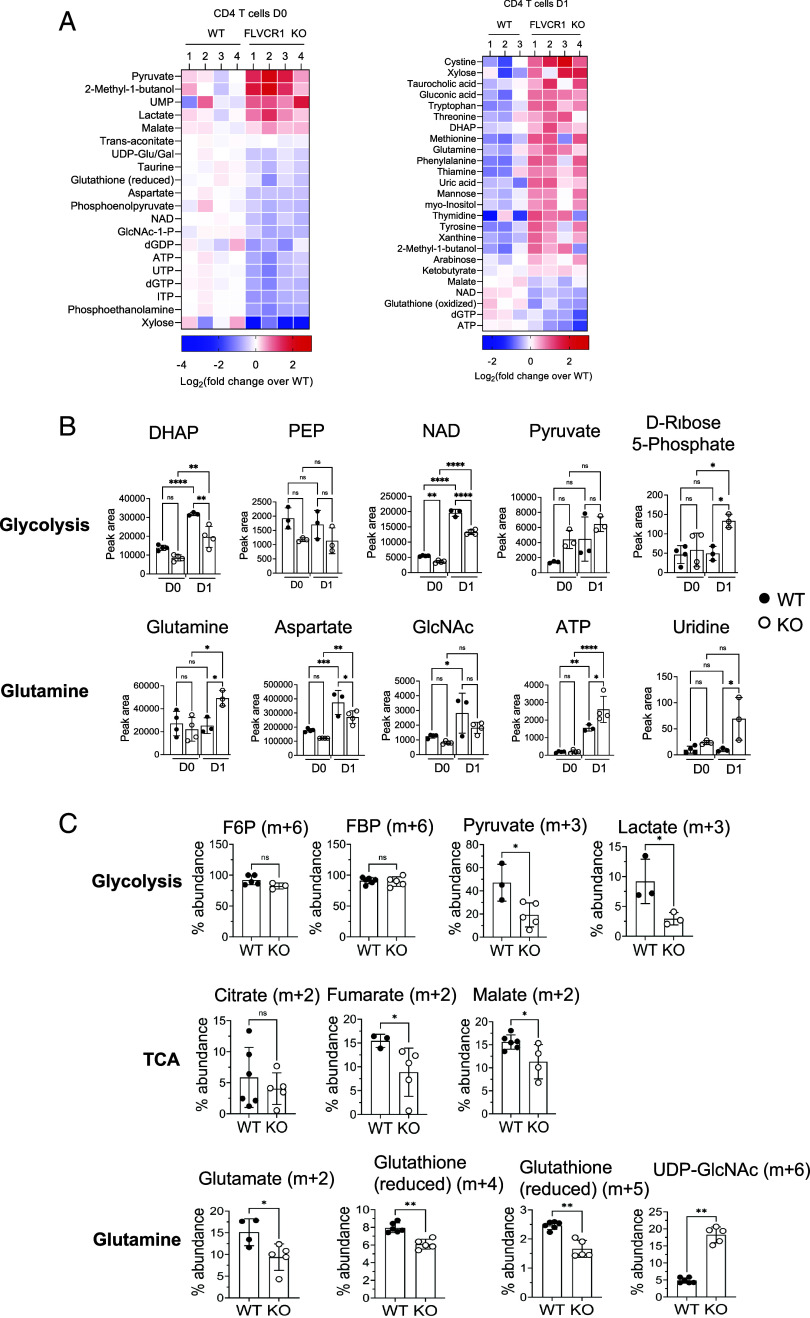
Fig. 6.
Iron overload remodels metabolic programming in naive CD4 T cells. Sorted naive CD4 T cells from WT and KO mice were activated, and metabolites were extracted from unstimulated (D0) and stimulated cells (D1). Metabolite extracts were subjected to targeted metabolomic analysis using LC–MS/MS with a reference library of 230 metabolites. (A) Heat maps show significantly different amounts of metabolites between KO and WT naive CD4 T cells at D0 (Left) and D1 (Right) (n = 3). (B) Graphs show relative levels of the indicated metabolites from glucose (Upper) and glutamine (Lower) metabolism pathways (n = 3 to 4). (C) WT and KO naive CD4 T cells were stimulated for 1 d in glucose-free RPMI containing glutamine (2 mM) and [13C6]-glucose (11 mM). After 1 d of activation, cell extract was prepared and subjected to LC–MS analysis. Representative graphs show the percentage abundance of 13C6-glucose-derived carbon in glycolysis (F6P, FBP, pyruvate, and lactate), TCA cycle (citrate, fumarate, and malate), glutamine metabolism (glutamate and GSH) and HBP (UDP-GlcNAc) intermediate metabolites. The error bars represent the mean ± SEM. *P < 0.05, **P < 0.01, ***P < 0.001, ns: not significant.

