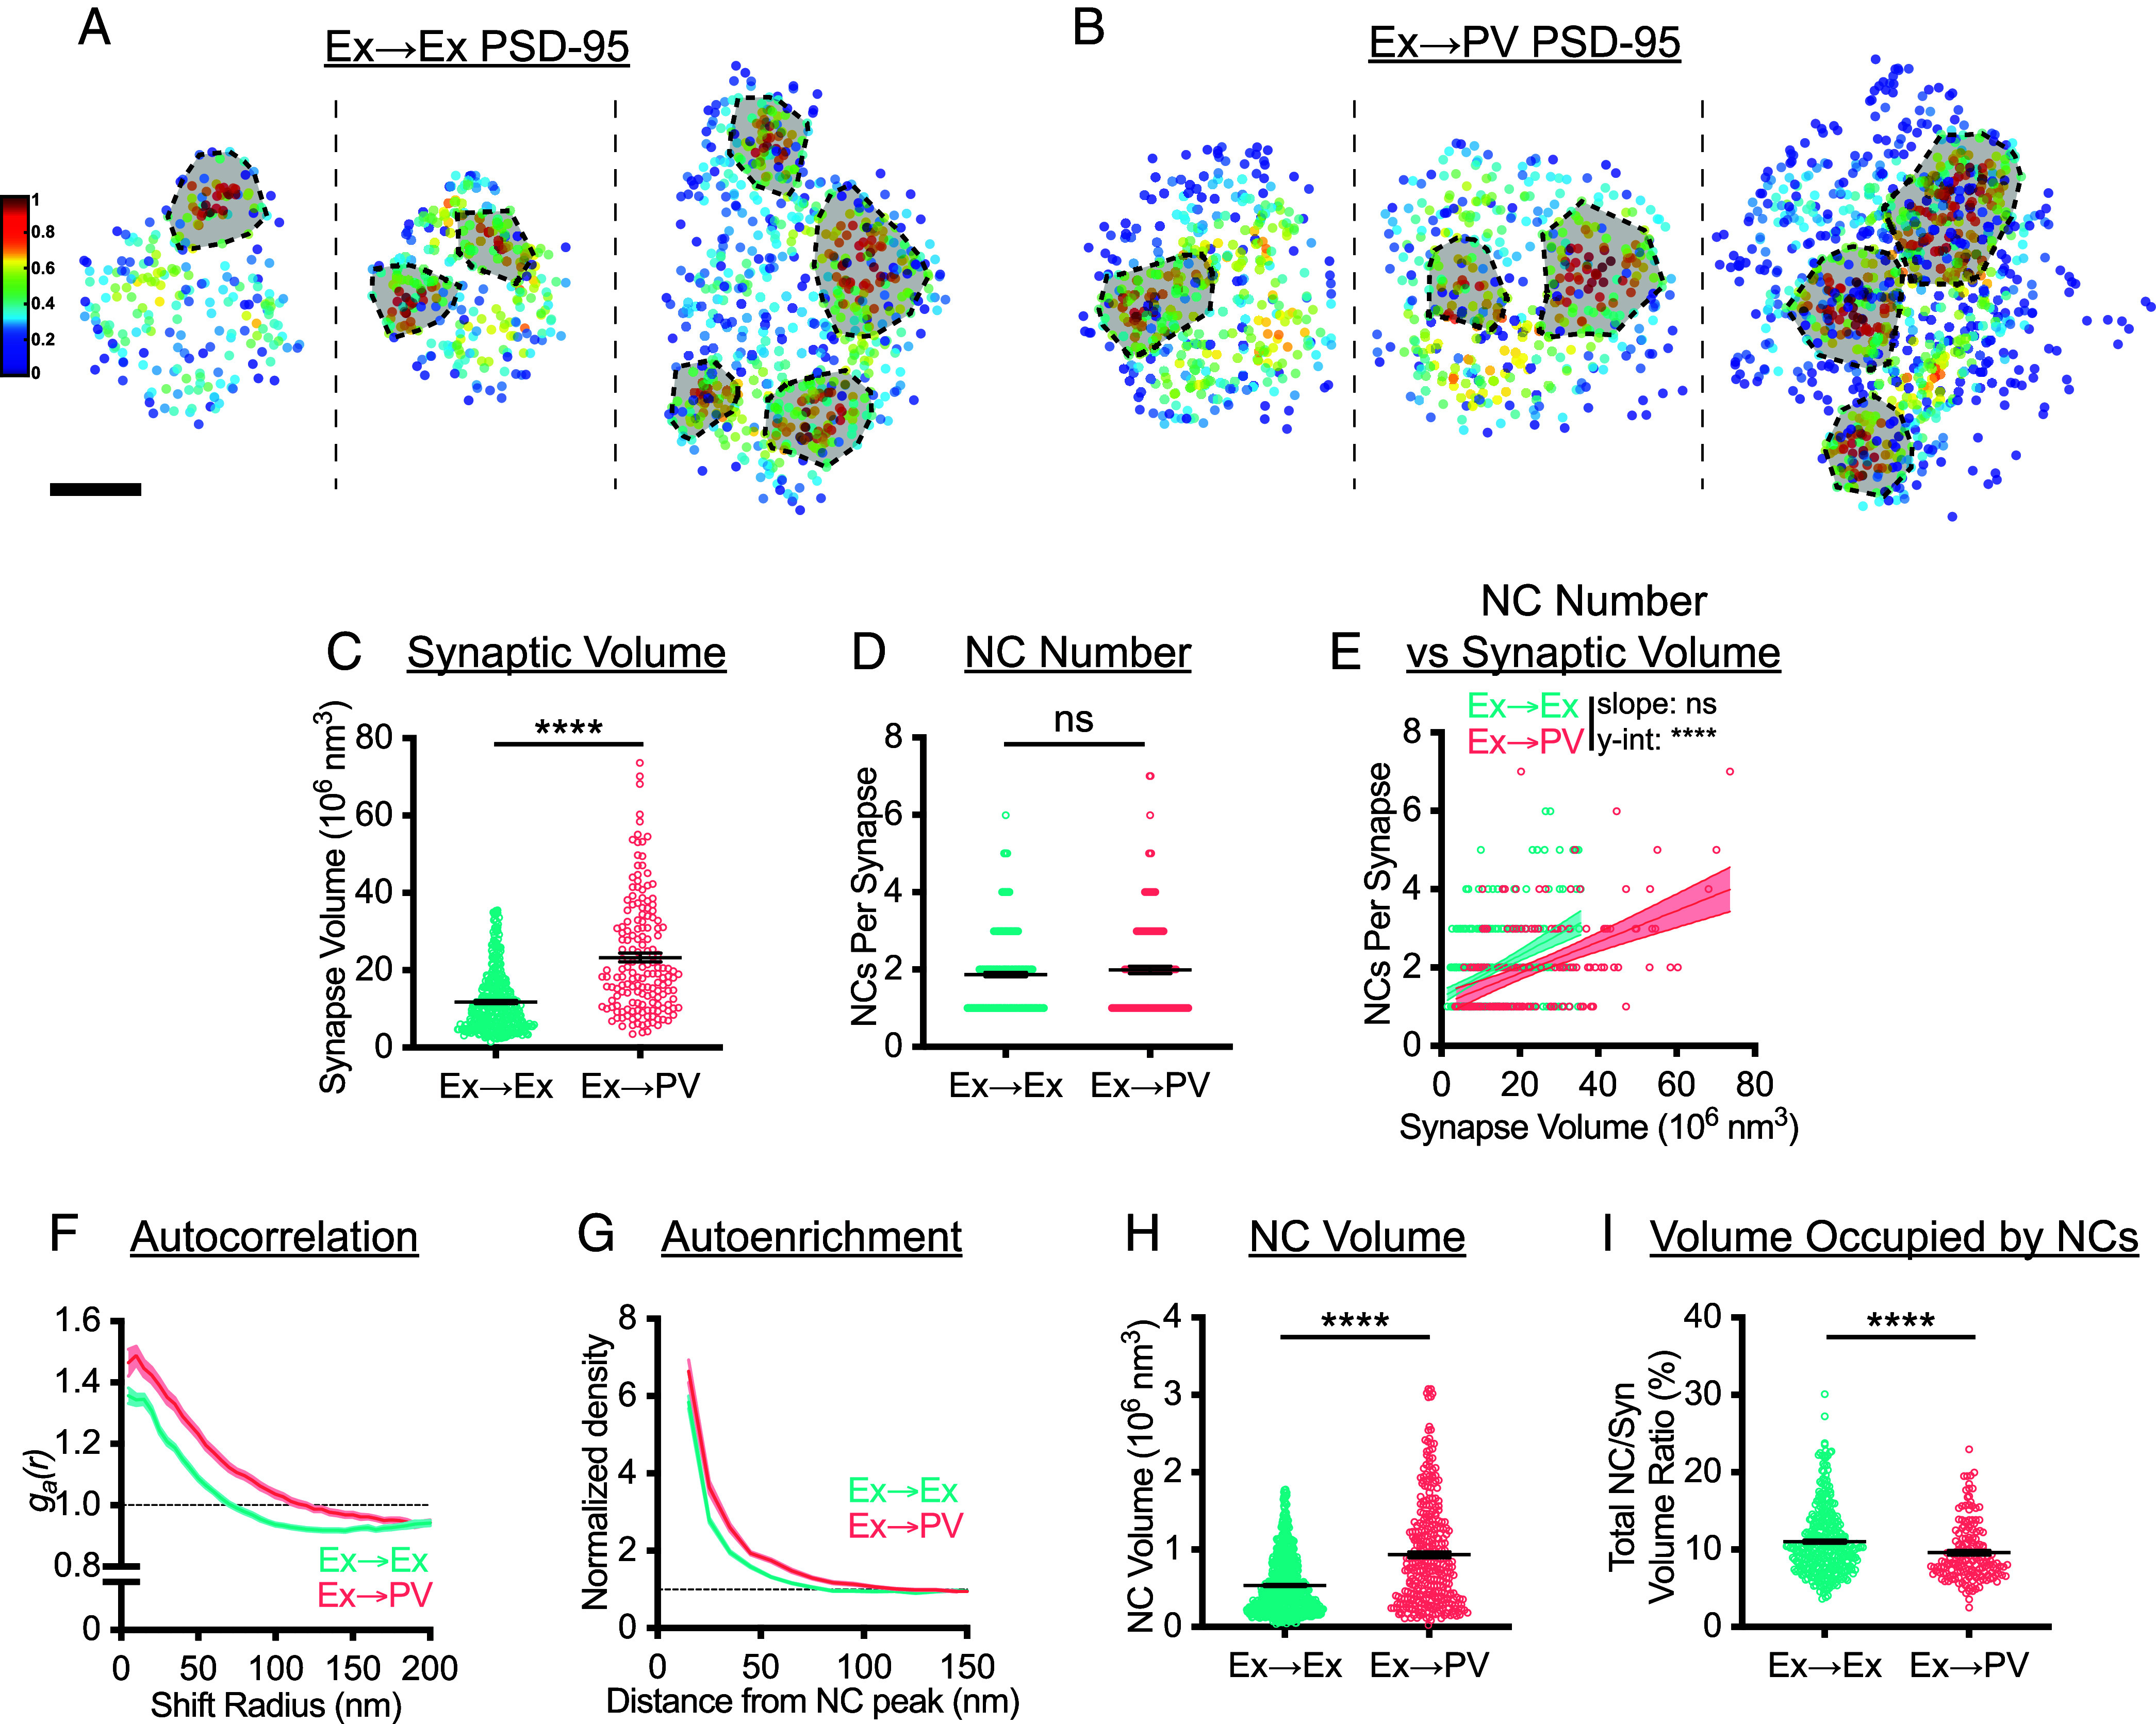
Fig. 2.

PSD-95 nanostructure is differentially organized depending on postsynaptic cell identity. (A and B) Examples of 3D DNA-PAINT PSD-95 synaptic clusters from (A) Ex→Ex and (B) Ex→PV synapses. Heat maps indicate the peak density–normalized local density. Black-bordered shapes indicate detected NCs. (Scale bar: 100 nm.) Parentheticals below indicate mean ± SEM. (C) PSDs are larger at Ex→PV synapses (Ex→Ex, 11.76 ± 0.41 × 10⁶ nm3; Ex→PV, 23.32 ± 1.14 × 10⁶ nm3; P < 0.0001). (D) Both synapse types contain the same number of PSD-95 NCs on average (Ex→Ex, 1.87 ± 0.054 NCs/synapse; Ex→PV, 1.99 ± 0.092 NCs/synapse; P = 0.4606). (E) Ex→PV PSDs contain fewer NCs than expected when accounting for PSD size (Ex→Ex, slope: 0.053, y-intercept: 1.25, R2: 0.17; Ex→PV, slope: 0.040, y-intercept: 1.058, R2: 0.24. slope P = 0.1009, y-intercept P < 0.0001). (F) Autocorrelation predicts PSD-95 forms larger, denser NCs in PV cells. (G) The average Ex→PV PSD-95 NC has a denser and broader PSD-95 distribution. (H) PSD-95 NC volume is larger at Ex→PV synapses (Ex→Ex, 0.54 ± 0.014 × 10⁶ nm3; Ex→PV, 0.94 ± 0.038 × 10⁶ nm3; P < 0.0001). (I) Less synapse volume is occupied by PSD-95 NCs at Ex→PV synapses (Ex→Ex, 11.03 ± 0.23% volume; Ex→PV, 9.62 ± 0.29% volume; P < 0.0001). Parentheticals above for (C, D, H, and I) list means ± SEM. Data in C–E and I are individual synapses, and in H individual NCs, with lines at mean ± SEM. Data in E are plotted with line of best fit ± 95% CI. Data in F and G show a line connecting the mean of each bin ± SEM shading. For Ex→Ex, n = 372 synapses or 667 NCs; for Ex→PV, n = 168 synapses or 327 NCs throughout.
