Fig. 1.
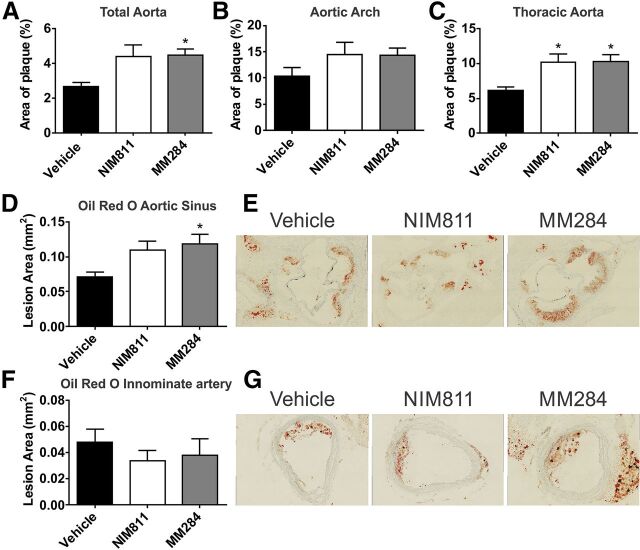
Effect of cyclophilin inhibition on atherosclerosis. (A–C) En face analysis of total aorta (A), aortic arch (B), and thoracic aorta (C). Lesion burden was calculated as a percentage of Sudan IV–stained area from total vessel area. (D) Cross-sectional analysis of total lesion area in the aortic sinus stained with Oil red O. (E) Representative micrographs of the aortic sinus stained with Oil red O. (F) Cross-sectional analysis of total lesion area in the innominate artery stained with Oil red O. (G) Representative micrographs of Oil red O–stained sections of the innominate artery. All graphs are presented as mean ± S.E.M. *P < 0.05 versus vehicle.

