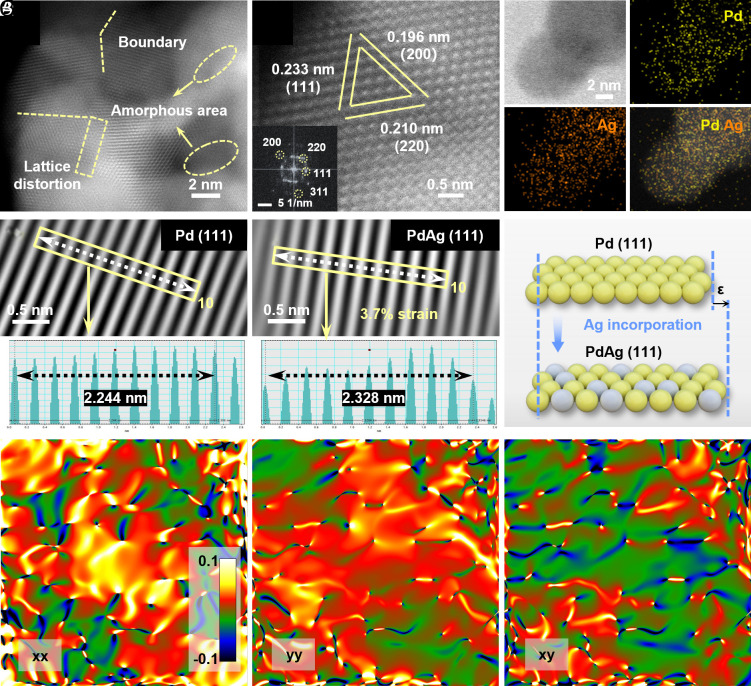
Fig. 2.
Aberration-corrected HAADF-STEM images of Pd67Ag33 aerogel. (A) TEM image and (B) high-resolution TEM image and the corresponding FFT pattern of Pd67Ag33 aerogel. (C) HAADF-STEM and the corresponding elemental mapping images of Pd67Ag33 aerogel. (D and E) Inverse IFFT images of Pd and Pd67Ag33, the Insets correspond to the lattice spacing distribution. (F) Illustration for the lattice expansion of Pd and Pd67Ag33. (G–I) Maps of the in-plan strain tensors xx, yy, xy, processed via GPA (the color regions ranging from green to dark blue denote the compressive strain, while the regions from red to bright yellow represent the tensile strain).

