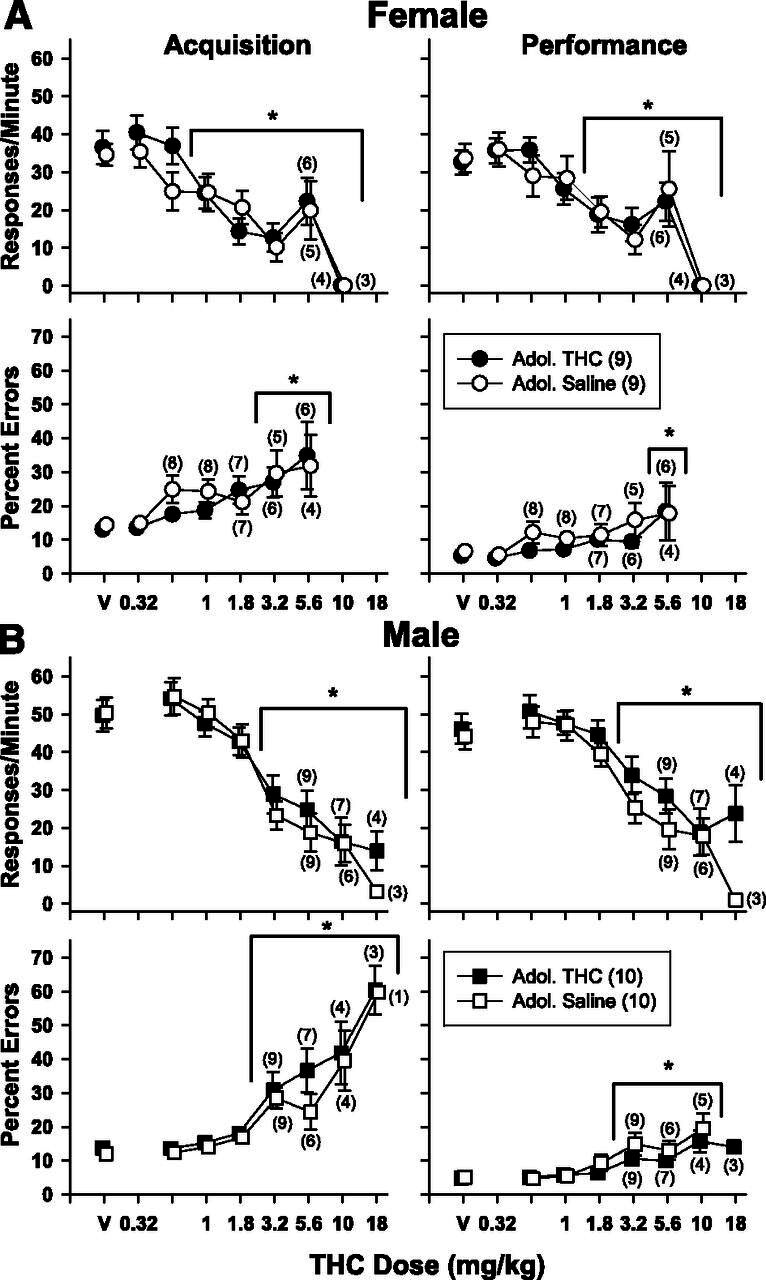
Fig. 2.

Mean effects of acute THC administration on response rate (upper panels) and percent errors (lower panels) in subjects responding under a repeated acquisition and performance procedure. Top panels (A) show the effects of THC on female subjects, and bottom panels (B) show the effects of THC on male subjects. Circles represent female subjects, and squares represent male subjects. Unfilled symbols represent subjects that received saline daily during adolescence, whereas filled symbols represent subjects that received 5.6 mg/kg daily of THC during adolescence. Asterisks and brackets represent a significant difference between a given drug dose and vehicle as determined by two-way repeated-measures ANOVA tests.
