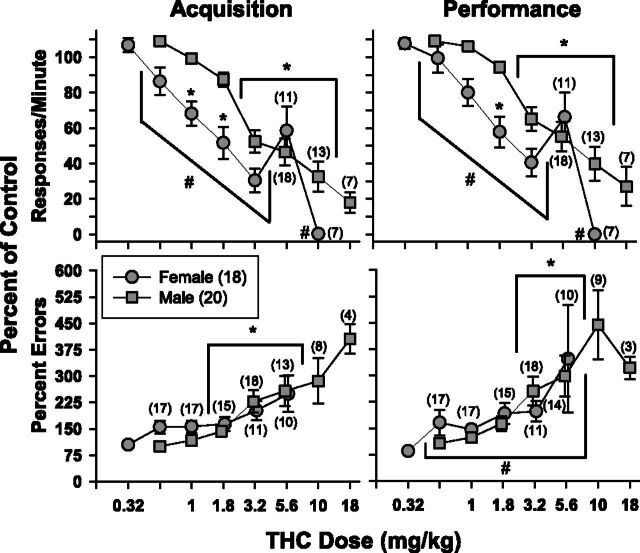
Fig. 3.
Mean effects of THC on response rate (upper panels) and percent errors (lower panels) in 38 subjects responding under a repeated acquisition and performance procedure. Circles represent data from female subjects, whereas squares represent data from male subjects. Two-way ANOVA tests were used to determine statistical significance. Asterisks and brackets represent doses that were significantly different than vehicle injections; pound signs and brackets represent doses that were significantly different between male and female subjects.

