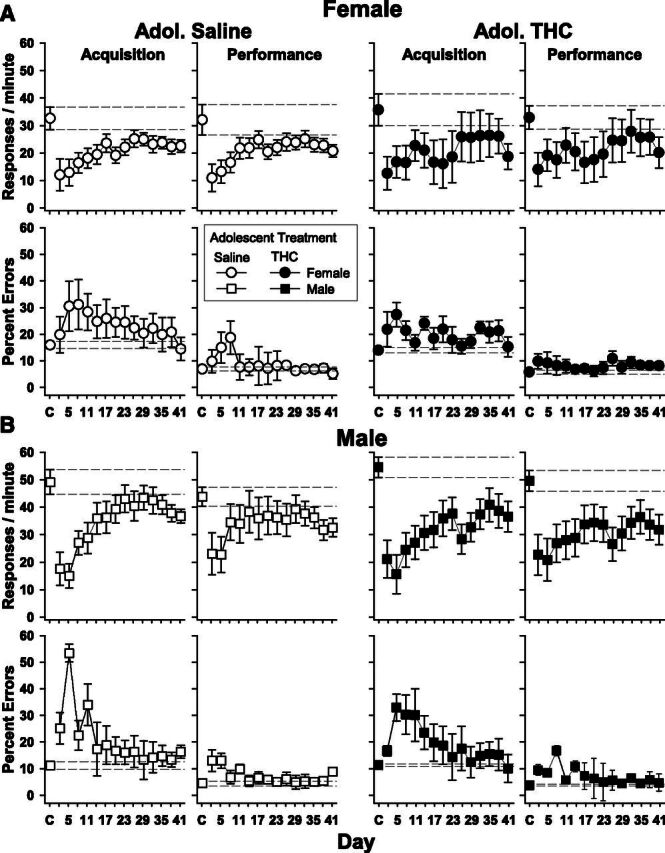
Fig. 5.

Mean effects of 41 consecutive days of 10 mg/kg of THC on response rate and percent errors in the acquisition and performance components of the procedure. The points and vertical lines above C represent the mean and S.E. for at least seven control (vehicle) injections during the first experiment. Dashed lines represent an extension of the control range for easy comparison with the chronic THC data. All other data points and vertical lines represent the grouped mean and standard error of the mean for 3 consecutive days. Unfilled symbols represent subjects that received saline daily during adolescence; filled symbols represent subjects that received 5.6 mg/kg daily of THC during adolescence. Squares represent males, and circles represent females.
