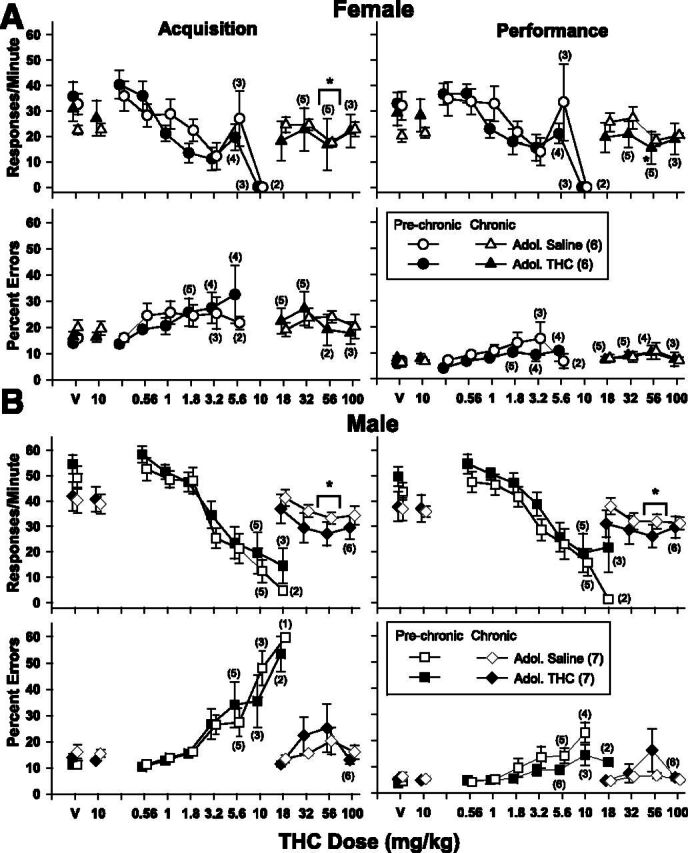
Fig. 6.

THC dose-effect curves for response rate (upper panels) and percent errors (lower panels) in the acquisition and performance components of the procedure after 40 or more days of 10 mg/kg of THC in 26 subjects. Top panels (A) show dose-effect curves for female subjects with (filled symbols) and without (unfilled symbols) a history of THC administration during adolescence. Bottom panels (B) show dose-effect curves for male subjects with and without a history of THC administration during adolescence. Circles (females) and squares (males) represent the effects of THC before chronic administration; triangles (females) and diamonds (males) represent the effects of THC after developing tolerance to 10 mg/kg of THC. Unfilled symbols represent subjects that received saline daily during adolescence; filled symbols represent subjects that received 5.6 mg/kg daily of THC during adolescence. Asterisks and brackets represent a significant difference between a given dosage of THC and vehicle as determined by two-way repeated-measures ANOVA tests.
