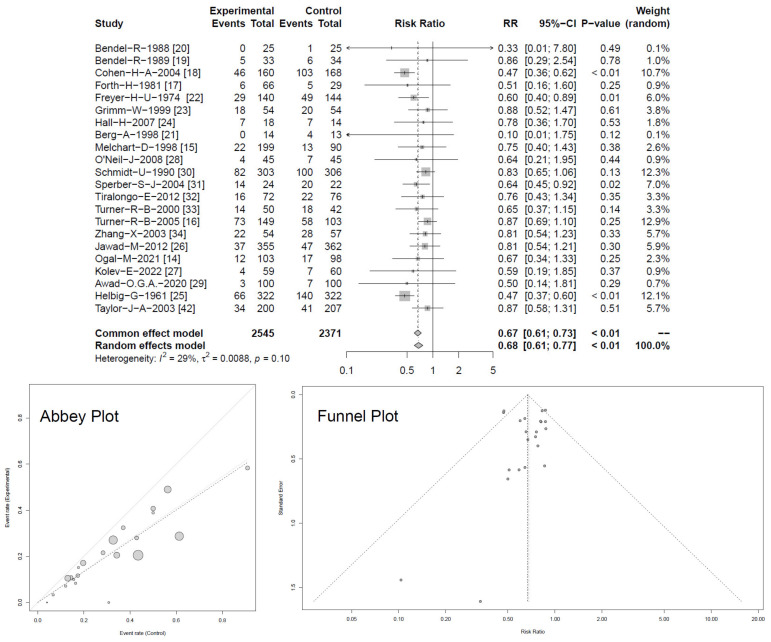
Figure 2.
Forest plot showing meta-analysis of overall risk for occurrence of RTIs between groups with Abbey and Funnel plots, indicating low risk of publication bias (for clearer Abbey and Funnel plots see Appendix B Figure A2 and Figure A3). Shown are “events” (RTIs), “total” (participants) for Echinacea (“experimental”) and control, risk ratios (RR) employing a common and random effect model, heterogeneity (I2), confidence intervals (95%-CI), p-value and individual weight of respective studies.

