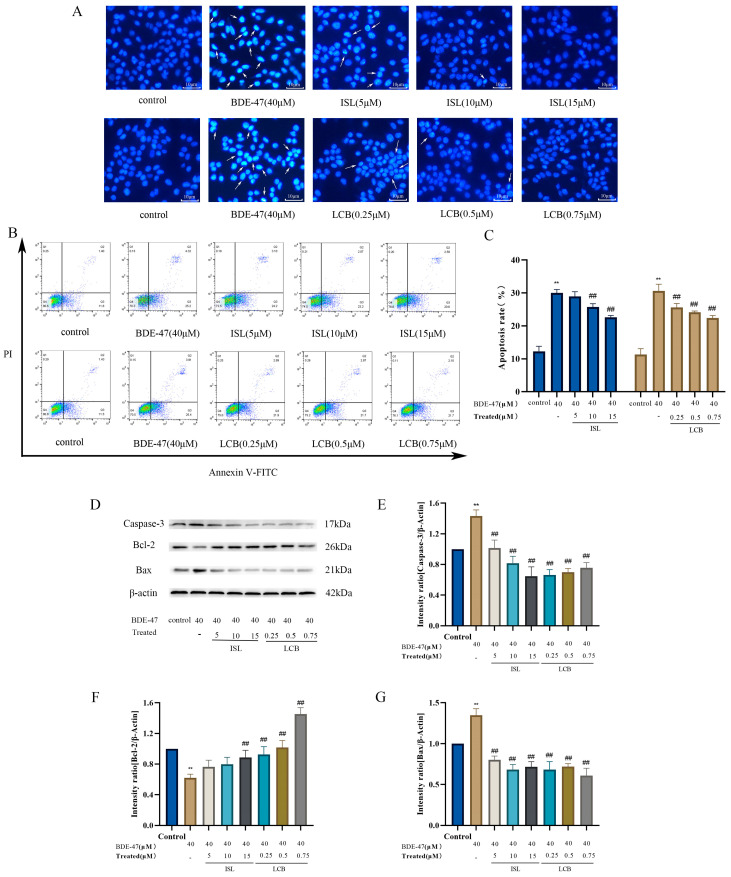
Figure 3.
The effects of ISL and LCB combined with BDE-47 on the apoptosis of RAW264.7 cells. (A) DAPI staining under an upright fluorescence microscope (200×) camera. The arrows point to cells with obvious apoptosis. (B) The representative cell apoptosis chart and (C) quantitative bar chart obtained from flow cytometry analysis. (D) The band patterns of the apoptotic proteins Caspase-3, Bax, and Bcl-2. (E–G) The quantitative statistics of the proteins. There was a significant difference compared to the control group (** p < 0.01). There was a significant difference compared to the BDE-47 group (## p < 0.01).

