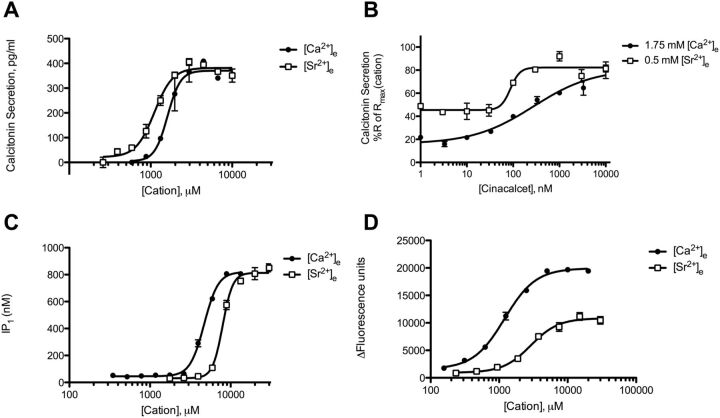
Fig. 2.
Characterization of concentration-dependent [Ca2+]e- and [Sr2+]e-mediated calcitonin secretion, IP1 accumulation, and [Ca2+]I mobilization in 6-23 cells. A, concentration-response curves of [Ca2+]e- and [Sr2+]e-mediated calcitonin secretion. B, concentration-response curves of allosteric modulation of [Ca2+]e- and [Sr2+]e-stimulated calcitonin secretion with cinacalcet. Responses are normalized to the calcitonin secretory response at 10 mM cation. C, concentration-response curves of [Ca2+]e- and [Sr2+]e-mediated IP1 accumulation. D, concentration-response curves of [Ca2+]e- and [Sr2+]e-mediated [Ca2+]i mobilization. Graphs are representative of three independent experiments.

