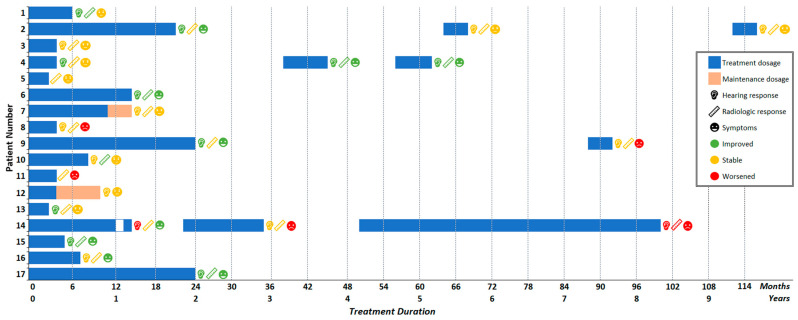
Figure 1.
Treatment regimens and response of individual patients in the cohort. Duration and dosage of treatment is indicated by bar length and coloring, respectively. At the end of each treatment course, hearing, radiologic, and symptomatic response were recorded. Symbols indicate the outcome of interest, coloring indicates an improved, stable, or worsened response. Four patients received more than one bevacizumab treatment course. Time interval between consecutive treatments corresponds to the white area between the horizontal bars.

