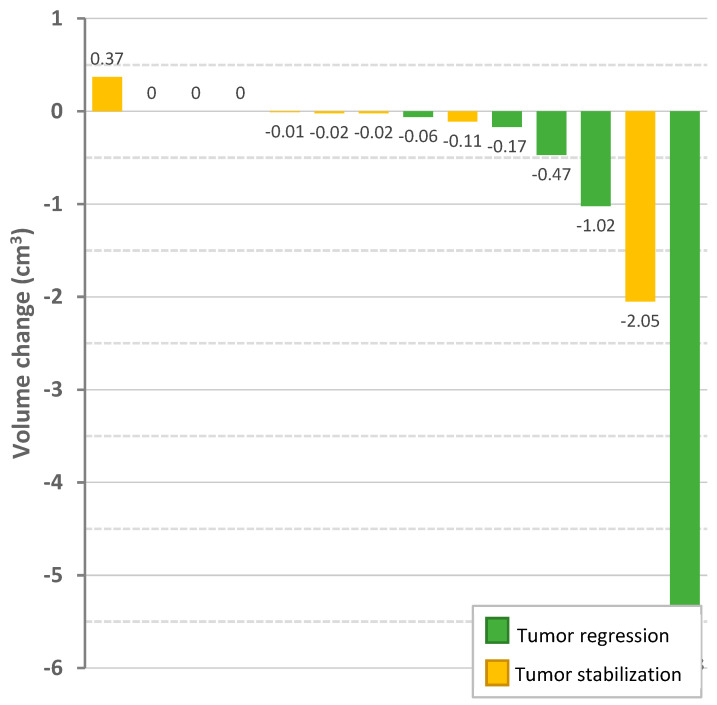
Figure 3.
Change in absolute extracanicular volume (cm3) of vestibular schwannomas after bevacizumab treatment. Vertical bars represent the target vestibular schwannoma of a patient. Coloring of the bars indicate the corresponding tumor response: green for tumor regression (volume change ≥20%), yellow for stable tumor (volume change between −20% and 20%). Three target vestibular schwannomas are not shown: one tumor was confined to the internal auditory canal, two other tumors were not followed up with MRI at the end of treatment.

