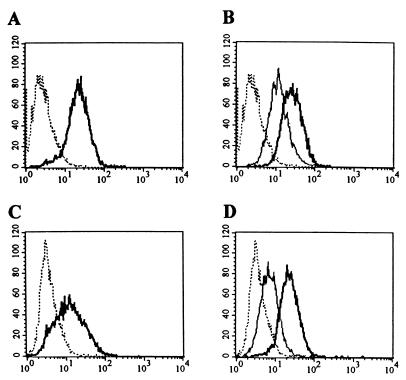
FIG. 7.
Flow cytometric analysis of human ovarian cancer cells. Expression of CAR, αvβ3, and αvβ5 integrins in SKOV3.ip1 or OV-4 cells was analyzed by flow cytometry essentially as described in the legend for Fig. 3. Expression of CAR in SKOV3.ip1 (A) and OV-4 cells (C) and of αvβ3 (thin line) and αvβ5 (heavy line) integrins in SKOV3.ip1 (B) and OV-4 (D) cells is shown. The results for the negative control are shown by the dotted line.

