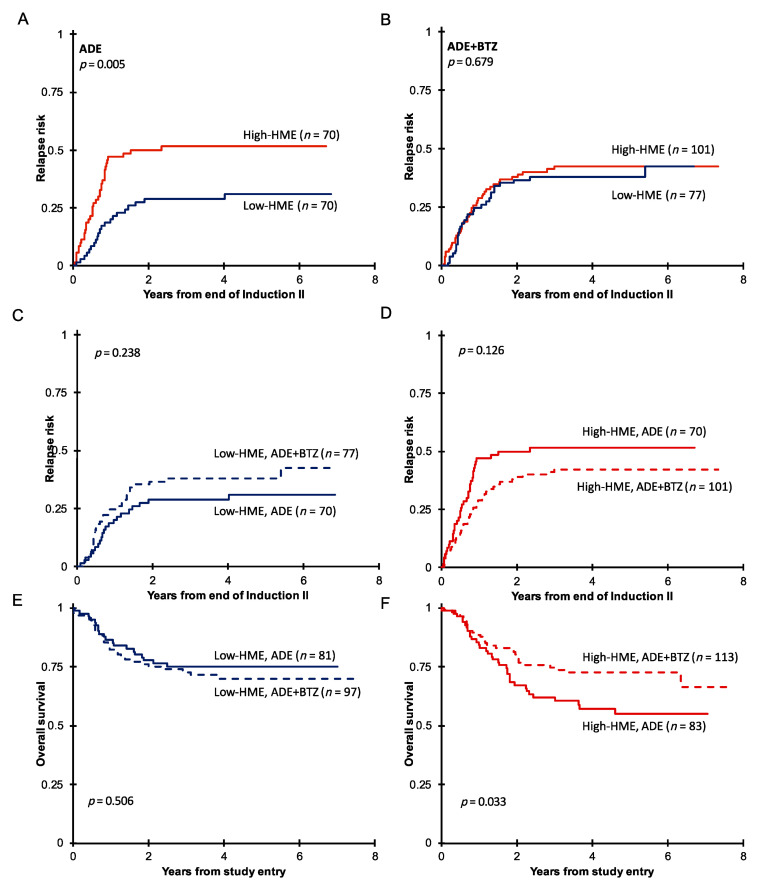
Figure 2.
(A) Remission duration after two courses of induction therapy with ADE (n = 164) or (B) ADE+BTZ (n = 210) in treated patients with high HME levels (red) compared to those with low HME levels (blue). Remission duration after two courses of induction therapy in (C) the low-HME and (D) high-HME populations separately in ADE vs. ADE+BTZ treatment regimes. Overall survival in (E) low-HME and (F) high-HME profile patients in ADE vs. ADE+BTZ.

