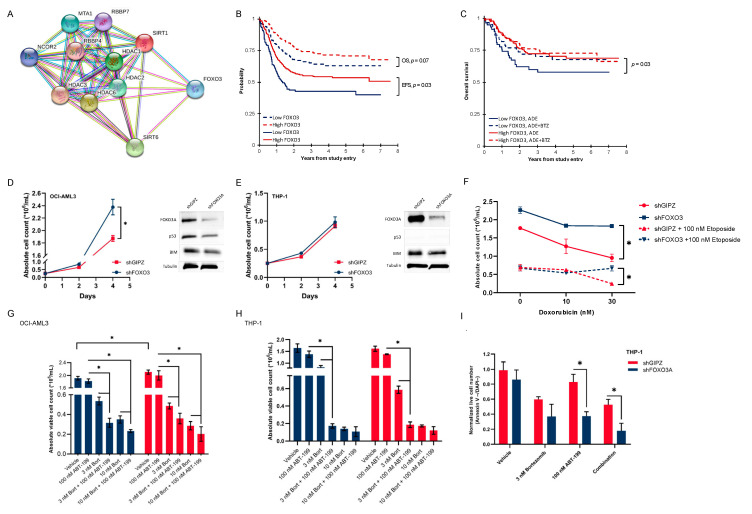
Figure 4.
(A) STRING network analysis for proteins that correlated with histone deacetylase (HDAC1, HDAC2, HDAC3, HDAC6, SIRT1 and SIRT6) revealed an association with transcription factor FOXO3; (B) overall survival (OS) and event-free survival (EFS) according to FOXO3 stratification in pediatric AML (n = 410); (C) OS according to FOXO3 stratification (low FOXO3 levels, blue and high FOXO3 levels, red) and treatment group (ADE, solid lines and ADE+BTZ, dashed lines); (D) growth curves of FOXO3 knockdown in p53-WT OCI-AML cells (shFOXO3, blue) compared to controls (shGIPZ, red) (day 4, p = 0.004) along with Western Blot showing protein expressions of FOXO3A, p53, BIM and Tubulin as loading control in shFOXO3 vs. shGIPZ at baseline; (E) growth curves of FOXO3 knockdown in p53-null THP-1 cells (shFOXO3, blue) compared to controls (shGIPZ, red) along with Western Blot showing protein expressions of FOXO3A, p53, BIM and Tubulin as loading control in shFOXO3 vs. shGIPZ at baseline, the uncropped blots and the densitometry readings/intensity ratio of each band are presented in Figure S8; (F) THP-1 shFOXO3 cells were more resistant to doxorubicin and a combination of doxorubicin and etoposide after 72 h compared to control (shGIPZ); (G) viable cell count without (Vehicle) with a single bortezomib (Bort) and venetoclax (ABT-199) treatment and in combination with shFOXO3 and shGIPZ OCI-AML3 cells after 72 h; (H) viable cell count without (Vehicle) with single bortezomib (Bort) and venetoclax (ABT-199) treatment and in combination with shFOXO3 and shGIPZ THP-1 cells after 72 h; (I) Annexin V and DAPI staining (normalized live cell number) in shFOXO3 and shGIPZ THP-1 cells after single 3 nM bortezomib and 100 nM ABT-199 treatment as well as in combination after 72 h. * p value < 0.05.

