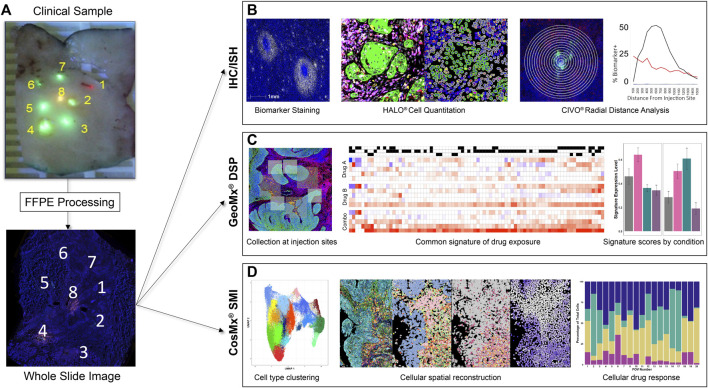
FIGURE 2.
CIVO Phase 0 Analysis Workflow (A). Formalin-fixed tissue sections are received by Presage, processed, embedded, and cut at 4 μm onto glass slides. (B). For IHC/ISH staining, slides are stained using fluorescent detection of antibody/probe and scanned on a whole-slide scanner. Cell segmentation and biomarker analysis is performed using HALO® (Indica Labs) to attain cell-level data. This is then measured over radial distance from the injection site to visualize the changes in drug effect across the gradient of drug exposure from the injection site. (C). For GeoMx® DSP, slides are stained for morphology markers and a GeoMx probe mix of barcoded RNA probes, then probes are photocleaved and collected from areas of interest (AOIs) around each injection site. Probe counts are quantified using next-generation sequencing and matched to their corresponding genes, which are compared across treatments to determine differentially expressed genes between injection sites. Common signatures of drug exposure are generated across patients in addition to patient specific responses. These signatures, as well as publicly available signatures, can then be used to score the injection sites by patient and drug. (D). For CosMx® SMI, slides are prepped with CosMx Universal Cell Characterization Panel RNA probe set, then probes are counted at a single cell level within predefined fields of view (FOVs) at each injection site. Cells are defined and clustered based on differential RNA expression. This data can then be used to spatially reconstruct the tumor areas, allowing comparisons of parallel IHC images to cell type, drug response and drug exposure. Cell type or expression data can also be used to compare FOV composition or signature scores to drug exposure quantitatively.

