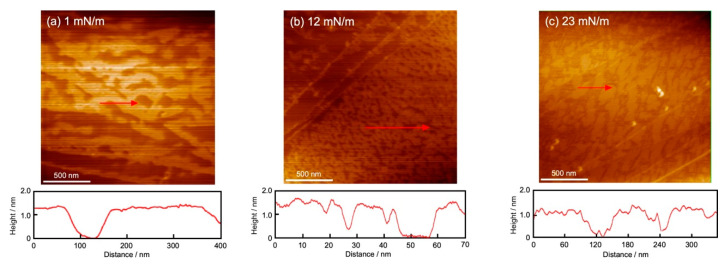
Figure 5.
AFM images of GD and Al monolayers scooped on the HOPG surface after each monolayer formation at 26 °C using the DM. (a,b): GD (dimer) monolayer; (c): Al monolayer. Observation range: 2 µm × 2 µm. Inserted surface pressures correspond to the values in each π-A isotherm curve in Figure 2. Red arrow and cross-section profile: thickness (height) of each GD and Al monolayer in the arrow range.

