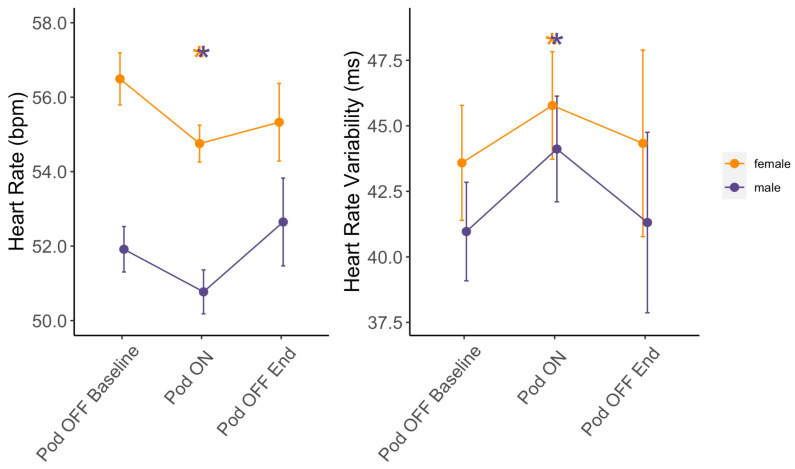
Figure 2.
Changes in HR and HRV based on Pod temperature status. Means ± SE for minimum sleeping HR and median sleeping HRV at Pod OFF Baseline, Pod ON, and Pod OFF End stratified by sex (females in orange and males in purple). * Indicates a significant difference in linear mixed models from Pod OFF Baseline at p < 0.05.

