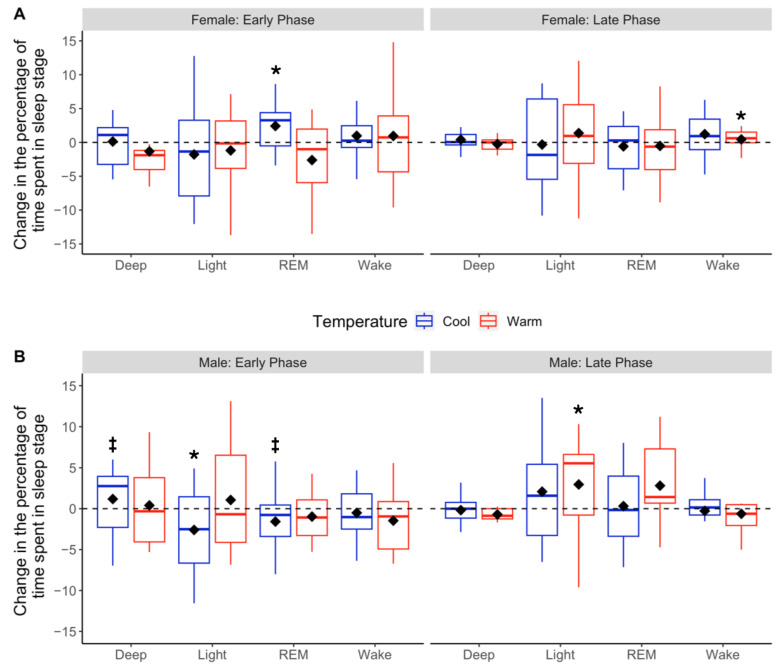
Figure 5.
Changes in the percentage of total sleep time spent in each sleep stage based on cool vs. warm temperatures in Early and Late Phases. Boxplots depicting distributions of changes in the percentage of time spent in each sleep stage for Pod OFF vs. cool (blue) or warm (red) temperatures. Early Phase (left-hand panels) and Late Phase (right-hand panels) are separated for females (A) and males (B). The black diamonds denote means, and the horizontal lines within the boxes denote medians. The dotted line at 0 indicates no change from Pod OFF Baseline to Pod ON. * Indicates a significant difference in linear mixed models from Pod OFF Baseline at p < 0.05, and ‡ indicates trending toward significance at p < 0.10.

