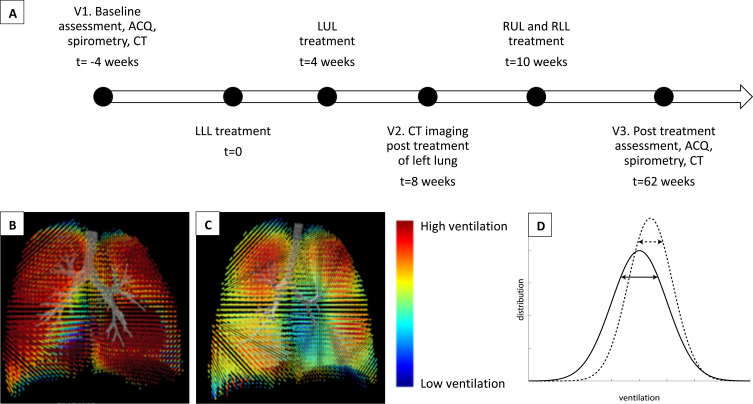
Figure 1.
Timeline and methodology. (A) Timeline for treatment and assessment. (B–C) Functional respiratory imaging derived regional ventilation map showing (B) homogeneous ventilation in a healthy subject, and (C) ventilation heterogeneity in a subject with severe asthma. (D) Schematic representation of expected changes in the ventilation histogram before (solid line) and after (dotted line) BT. The diagram illustrates a reduction in spread or standard deviation in the post-BT histogram, signifying a reduction in ventilation heterogeneity after BT.
Abbreviations: ACQ, asthma control questionnaire; BT, bronchial thermoplasty; CT, computed tomography of the chest; LLL, left lower lobe; LUL, left upper lobe; RLL, right lower lobe; RUL, right upper lobe.

