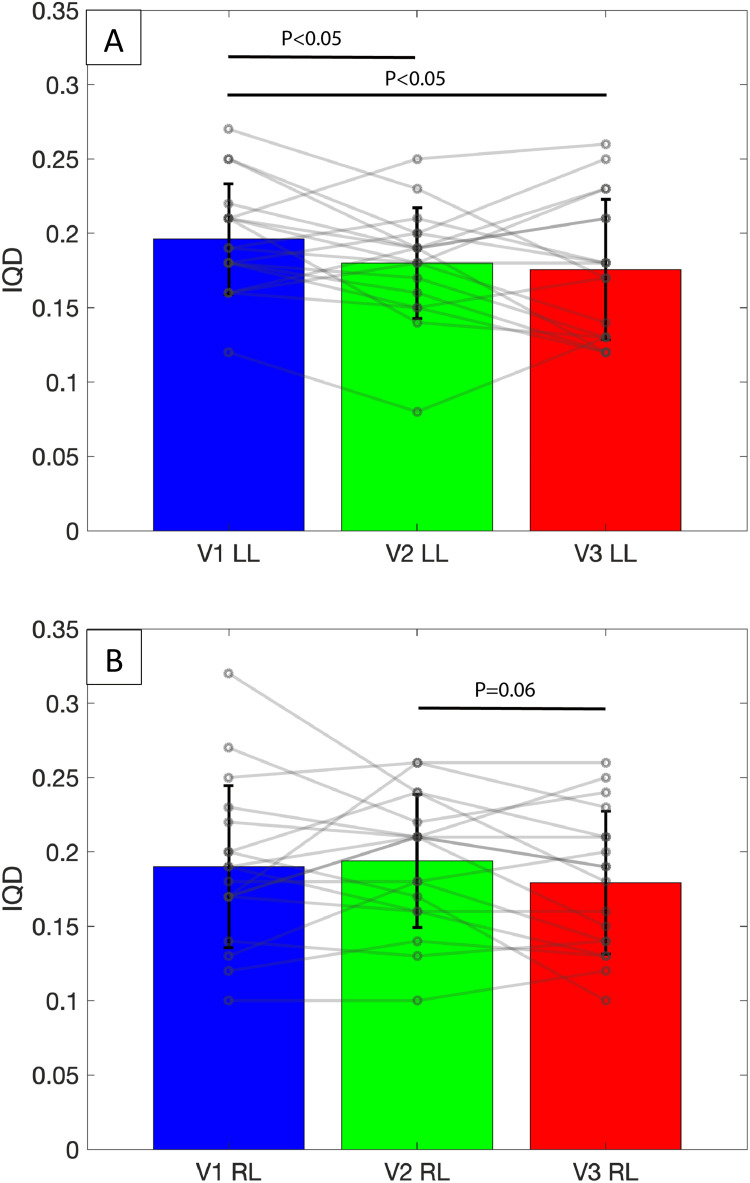
Figure 2.
IQD values reported at the lung level across various timepoints. Bars and error bars represent mean and standard deviation. Open circle represents individual data-points. (A) Mean IQD significantly decreased after treatment of the left lung, with treatment effect persisting up to 12 months after BT. (B) There was a trend towards a significant decrease in IQD after treatment of the right lung, with no other significant changes noted across timepoints.
Abbreviations: IQD, interquartile distance of the ventilation histogram; V1, baseline; V2, 4-week post treatment of left lung; V3, 12-month post treatment of right lung; LL, left lung; RL, right lung.

