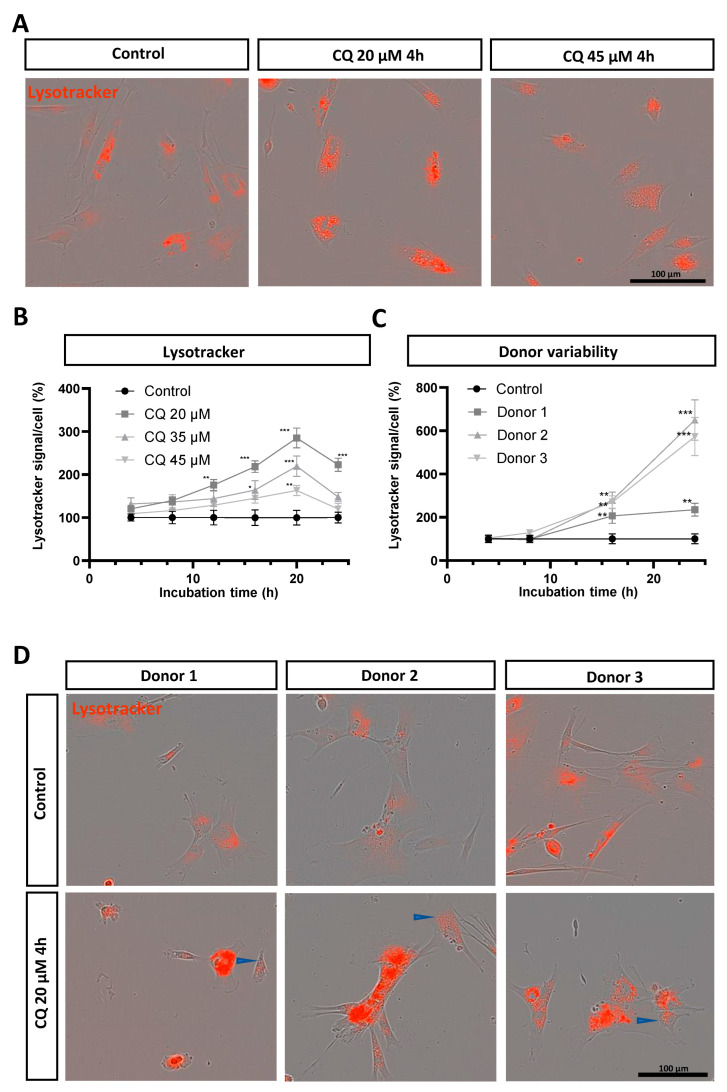
Figure 2.
Increased Lysotracker signal after chloroquine stimulation in DPSC-SCs. (A) Representative images of chloroquine-stimulated vs. unstimulated control DPSC-SCs over time. (B) An increase in Lysotracker signal was observed for all three tested chloroquine concentrations (i.e., 20, 35, and 45 µM). DPSC-SCs incubated with 20 µM and 35 µM of chloroquine stimulation show a gradually increased Lysotracker signal, reaching significance starting from 12 h for 20 µM and 16 h for 35 µM, and remaining visible after 24 h (endpoint). At 20 h of chloroquine incubation, all monitored concentrations show a significantly higher Lysotracker signal compared to control cells. (C) Donor variability in Lysotracker signal after chloroquine stimulation compared to unstimulated control cells. All donor lines show significantly increased Lysotracker signal after 16 h of chloroquine incubation. (D) Representative images of chloroquine-stimulated vs. unstimulated control DPSC-SCs in three different donor lines. Blue arrows represent loss of Lysotracker fluorescence on the luminal side in a limited number of lysosomes. Data are presented as mean ± SEM. * p < 0.05, ** p < 0.001, and *** p < 0.0001. (B,C): Two-way ANOVA Dunnett test. (C): Chloroquine-exposed cells are compared to unstimulated control cells from the same donor line. n = one experiment with four to seven technical replicates. CQ: chloroquine.

