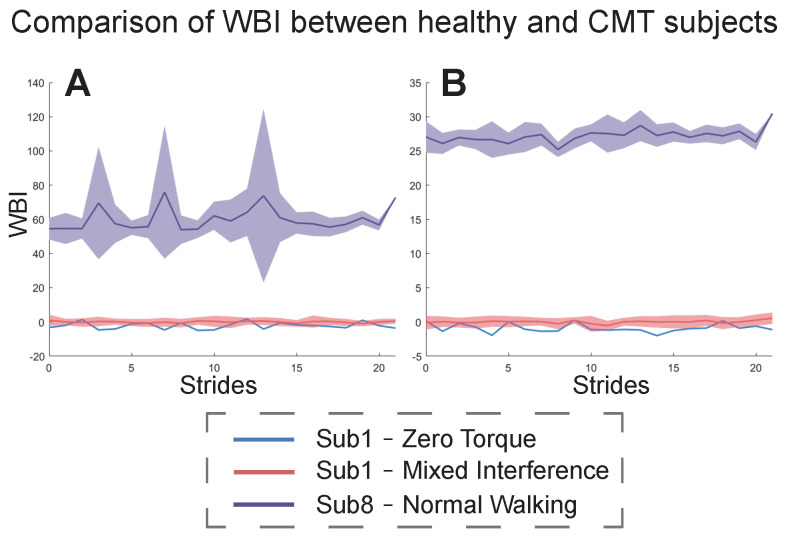
Figure 7.
WBI of healthy subject1 under ZT and MIX conditions and subject8 with CMT under the NW condition. (A) The results of the WBI constructed from subject8’s NW condition and subject1’s MIX condition. (B) The results of the WBI constructed from subject1’s ZT and MIX conditions. The blue curves show subject1’s WBI for each stride under the ZT condition. The red curves and areas show the mean and fluctuation range of subject1’s WBI under the MIX condition. The purple curves and areas show the mean and fluctuation range of subject8’s WBI under the NW condition.

