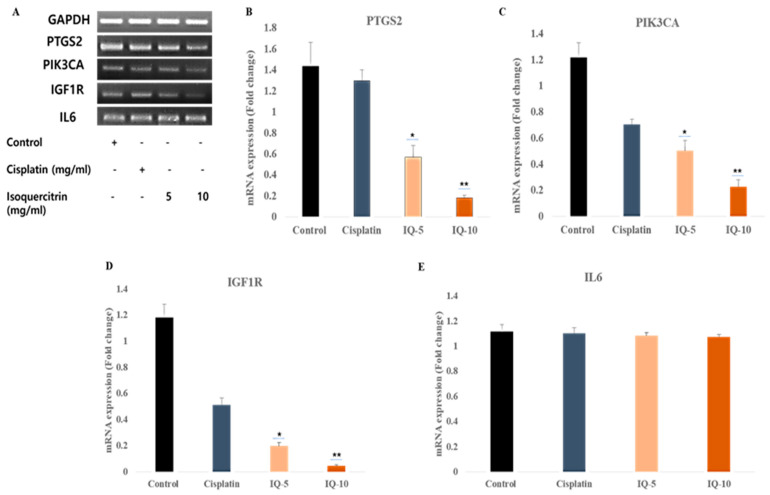
Figure 6.
Impacts of isoquercitrin (IQ) and cisplatin on the cDNA expression levels of genes linked to kidney cancer and inflammation in A498 cells. (A) RT-PCR and (B–E) qRT-PCR expression profile for targeted genes (control: without treatment, cisplatin: 10 μg/µL; and doses of IQ of 5 μg/µL and 10 μg/µL were applied for 24 h. Following the extraction of total RNA, we prepared cDNA then performed RT-PCR and qRT-PCR). For qRT–PCR, all results display the mean ± SE of duplicate samples from 3 independent experiments (* p < 0.05 and ** p < 0.01 using Student’s t-test compared to the non-treated control).

