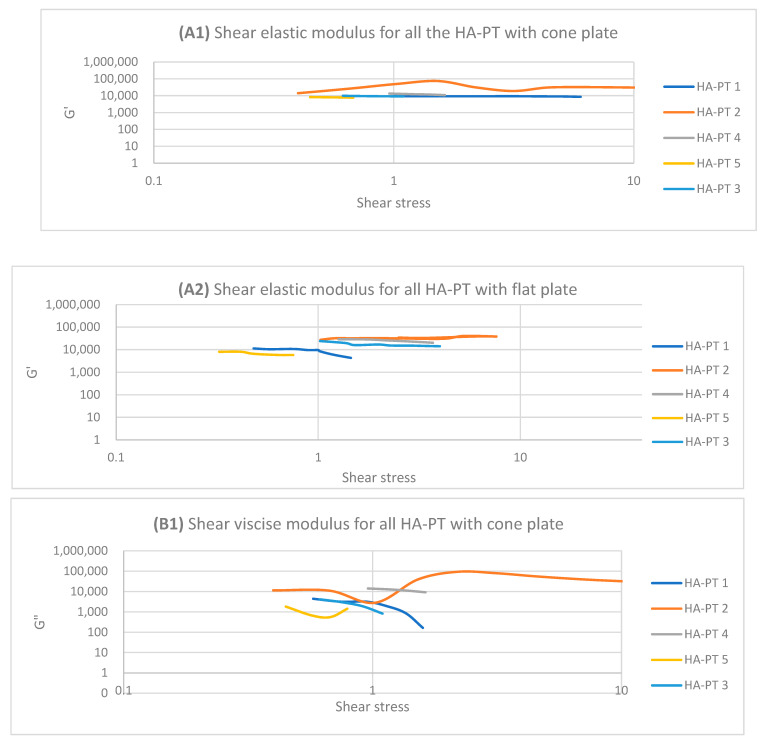
Figure 5.
Logarithmic plot of the amplitude sweep for all HA-PT 1, 2, 3, 4 and 5 formulations with cone and flat plates. (A1) Shear elastic modulus (G′) plot vs. shear stress with cone plate. (A2) Shear elastic modulus (G′) plot vs. shear stress with flat plate. (B1) Shear viscose modulus (G″) plot vs. shear stress with cone plate. (B2) Shear viscose modulus (G″) plot vs. shear stress with flat plate.


