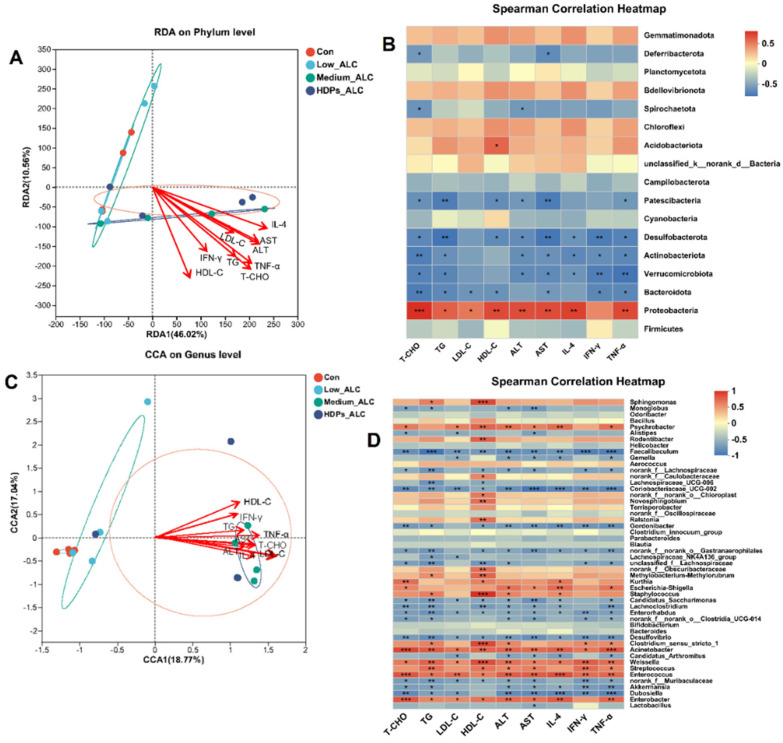
Figure 6.
Spearman correlation analysis between the presence of phylum and genus in the gut microbiota and the corresponding levels of serum and liver markers. (A,B) The relationship between the relative quantities of certain phyla in the gut microbiota and parameters of serum and liver; (C,D) The correlation between the prevalence of specific genera in the gut microbiota and serum and liver parameters. Red arrows indicate serum and liver parameters (A,C); Positive (red) and negative (blue) correlations between genera and liver parameters (B,D), * p < 0.05, ** p < 0.01, ***p < 0.001.

