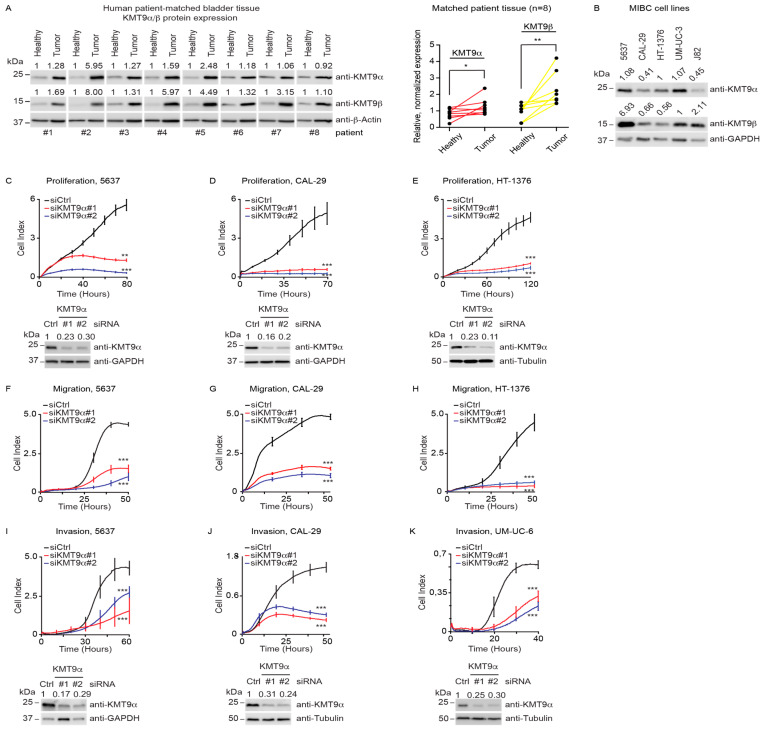
Figure 1.
KMT9 is expressed in human MIBC tissue and cell lines and regulates proliferation, migration, and invasion. (A) Western blots of matched tumor and tumor-free tissue samples from patients with MIBC TNM stage T3a,b. Right panel: quantification of Western blot data. Statistical significance was calculated by Wilcoxon test (*, p < 0.05; **, p < 0.01). (B) KMT9α and KMT9β expression in human BC cell lines (5637, CAL-29, HT-1376, UM-UC-3, J82). (C–E) Real-time proliferation of (C) 5637, (D) CAL-29, and (E) HT-1376 cells after transfection with siCtrl, siKMT9α#1, or siKMT9α#2. (F–H) Real-time migration of (F) 5637, (G) CAL-29, and (H) HT-1376 cells after transfection with the above-mentioned siRNAs and overnight starving in serum-free medium. (I–K) Real-time invasion of (I) 5637, (J) CAL-29, and (K) UM-UC-6 cells after transfection with the above-mentioned siRNAs and overnight starving in serum-free medium. (A–E,I–K) Western blots were performed with the indicated antibodies. The intensity of each protein band was quantified by densitometry and normalized to the intensity of the house keeping gene. The median value determined for healthy tumor tissue (A) or all shown MIBC cell lines (B), and the siCtrl value (C–E,I–K) were set to 1. (C–E) Western blots represent the knockdown for proliferation (C–E) and migration assays (F–H) since the same batch of cells was used. (C–K) A representative experiment for each cell line is presented displaying the mean ± standard deviation derived from four technical replicates. (C–K) Statistical significance was calculated by two-tailed Student t test (**, p < 0.01; ***, p < 0.001). Each experiment was independently conducted at least three times. The knockdown efficiencies of KMT9α were confirmed by Western blot. (A–E,I–K) The original Western blots with molecular weight markers and original data of densitometry scans are presented in Figures S3 and S4.

