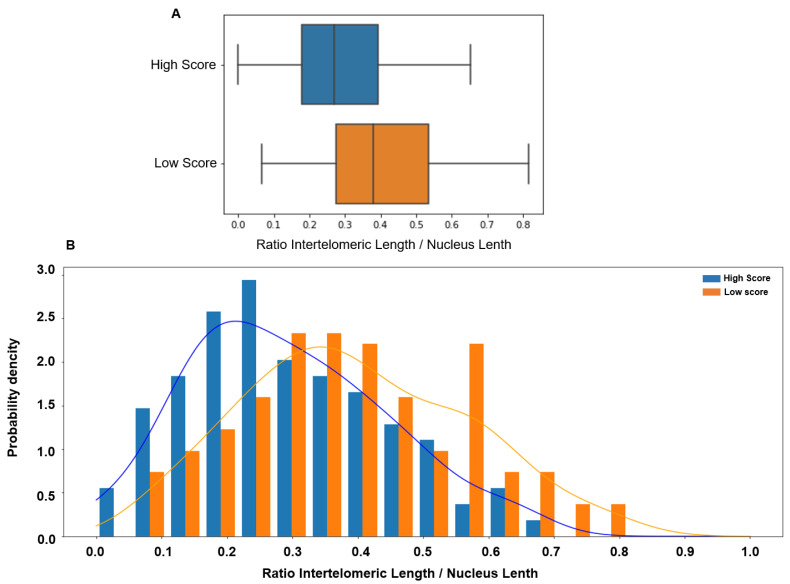
Figure 3.
(A) The inter-telomeric distance (ITD; normalized to the whole nucleus length) is significantly higher in patients with low score in orange (median 0.379, 95% CI [0.06 0.73]) than in patients with high score in blue (median 0.269, 95% CI [0.00 0.59], p < 0.00001). (B) The ITD value distribution in patients with low (orange) and high (blue) scores shows a significant overlap.

