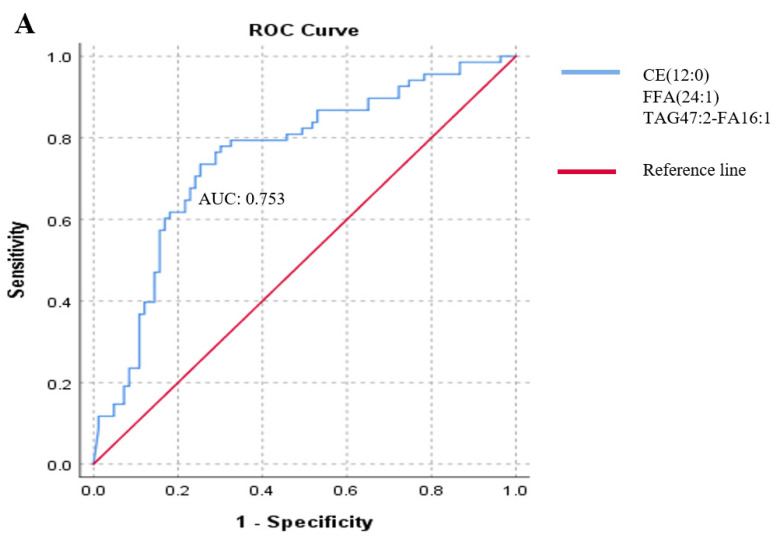
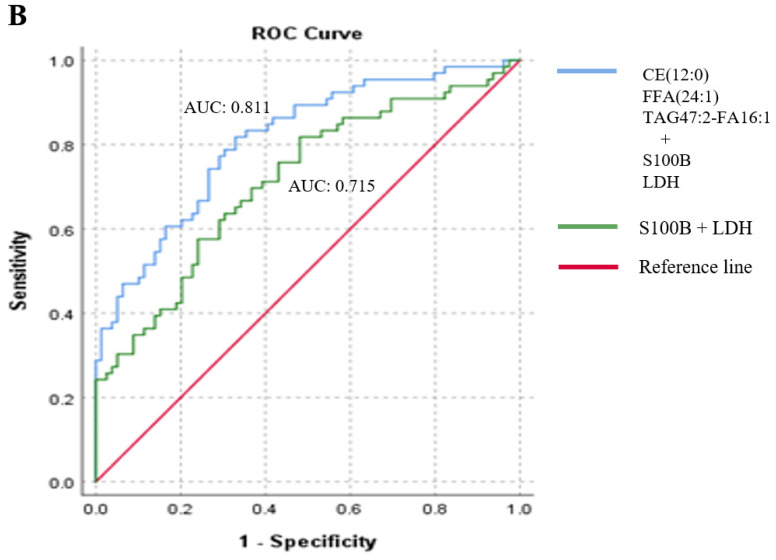
Figure 3.
Association of three lipid species and melanoma markers with the presence of melanoma metastases. During this analysis, receiver operating characteristic (ROC) classifier curves were used. (A) ROC curve analysis of three lipids (CE(12:0), FFA(24:1), and TAD47:2-FA16:1) associated with metastasis resulting from stepwise logistic regression (blue line), and the red line indicates the reference line. (B) ROC curve analysis of the three lipids combined with S100B and LDH melanoma markers associated with metastasis. The blue line represents three metastasis-associated lipids combined with S100B and LDH melanoma markers, the green line represents S100B and LDH melanoma markers, and the red line indicates the reference line. CE: cholesteryl ester; FFA: free fatty acid; TAG: triacylglycerol.


