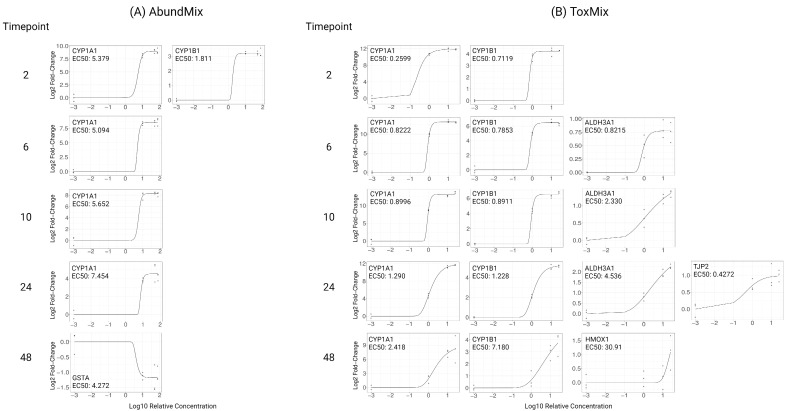
Figure 2.
Significantly altered transcriptional biomarkers from PAH mixture exposure as measured by qPCR. ALI-HBECs (n = 3) were apically treated with (A) AbundMix (75%, 50%, or 10%) or (B) ToxMix (25%, 10%, or 1%) for 2, 6, 10, 24, or 48 h in DPBS with a 1% DMSO vehicle. Data points represent individual replicate responses. Regression lines represent the fitted model curve for the data. EC50 = half maximal effective concentration represented as relative concentration. Significance was determined as at least one concentration having a significant difference (padj < 0.05) from the vehicle control as evaluated by a one-way ANOVA with Dunnett’s post hoc test. Created with BioRender.com (accessed on 10 April 2024).

