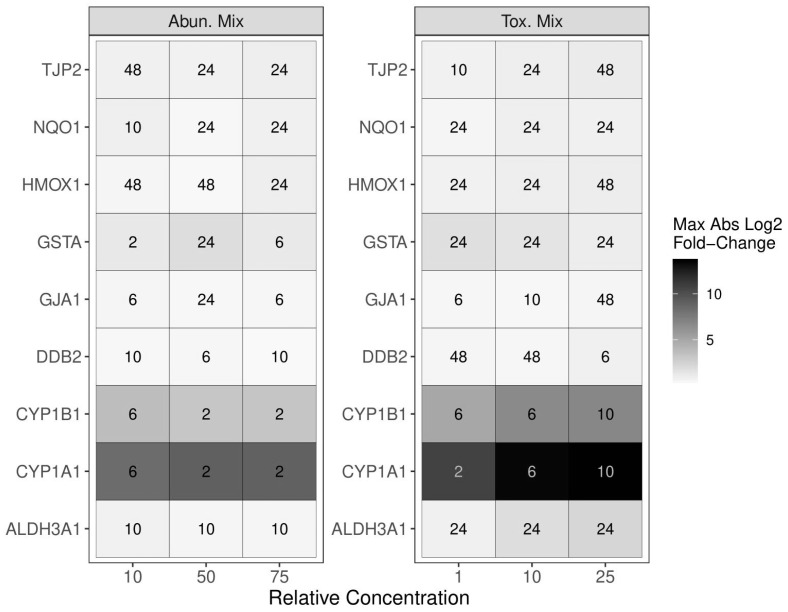
Figure 3.
A summary of the differential transcriptional expression by AbundMix (left) and ToxMix (right) exposure. ALI-HBECs (n = 3) were apically treated with ToxMix (25%, 10%, or 1%) or AbundMix (75%, 50%, or 10%) for 2, 6, 10, 24, or 48 h in DPBS with a 1% DMSO vehicle. Numbers in boxes represent the timepoint in hours of the maximal fold change occurrence for each gene and mixture relative concentration. The color represents the magnitude of the maximal fold change at the designated timepoint for each gene and mixture relative concentration.

