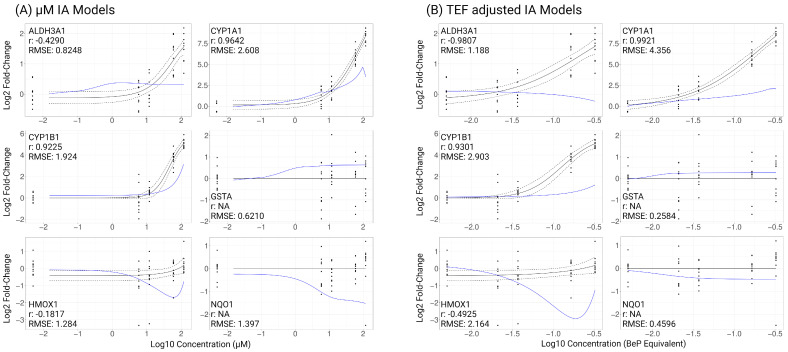
Figure 5.
Independent action (IA) models characterizing ToxMix response of transcriptional biomarkers using (A) µM concentration of components represented as log10 µM concentration and (B) TEF-adjusted concentration of components represented as log10 BeP equivalent concentration. Cells (n = 4) were apically treated with ToxMix, retene, BaF, BbF, BcF, triphenylene, BghiP, or BeP (10%, 5%, 1%, or 0.5%) for 24 h in DPBS with 1% DMSO vehicle. Black solid line indicates mean ToxMix response, black dots indicate individual sample responses for ToxMix treatment, and black dotted lines indicate standard error of ToxMix response. Blue line indicates IA model of ToxMix response based on individual component data. RMSE represents root-mean-square error between modeled response and ToxMix response curve, and r represents Pearson correlation between modeled response and ToxMix response curves. Created with BioRender.com (accessed on 10 April 2024).

