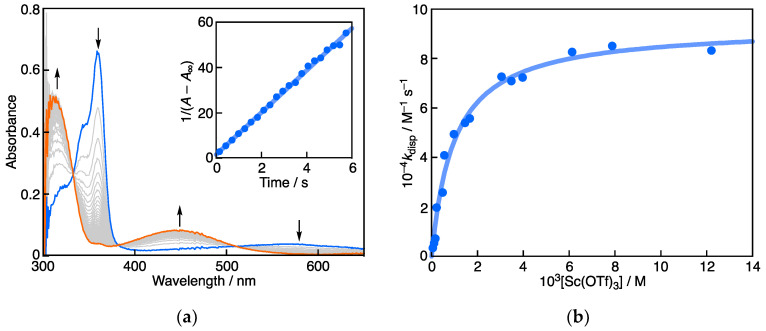
Figure 2.
(a) Spectral change (interval: 70 ms) observed during the reaction of PTIO• (5.5 × 10⁻⁵ M) with Sc(OTf)3 (7.9 × 10⁻³ M) in deaerated MeCN at 298 K. Blue and orange lines are the initial and final spectra, respectively. Arrows denote the direction of absorption changes. Inset: the second-order plot of the absorbance at 361 nm. (b) Plot of kdisp vs. [Sc(OTf)3] for the disproportionation of PTIO• (5.5 × 10⁻⁵ M) in the presence of Sc(OTf)3 in deaerated MeCN at 298 K.

