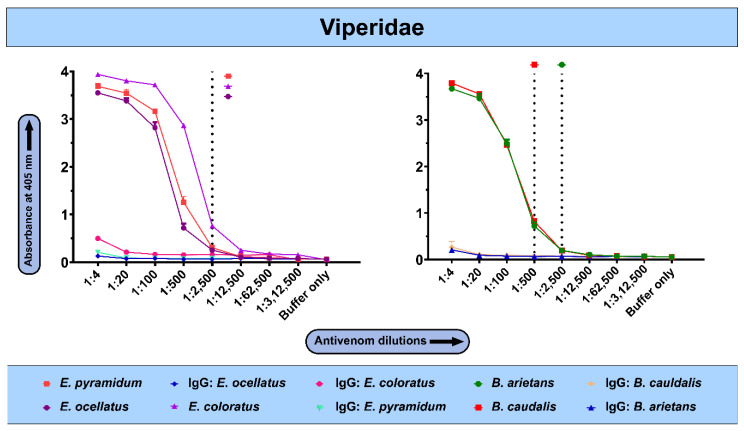
Figure 3.
In vitro binding potential of PANAF-Premium antivenom towards sSA viperids. The line graphs represent the binding of naive IgG (1:4) and PANAF-Premium antivenom towards viperid snake venoms from sSA. Absorbance at 405 nm was plotted against various dilutions of antivenom to determine the in vitro cross-reactivity. Each antivenom dilution was tested in triplicate, and the mean of these values was plotted, with the error bars representing standard deviations. Unique colour codes are used to represent individual snake species. The dotted line represents the titre value of the antivenom against the respective venom.

