Figure 1.
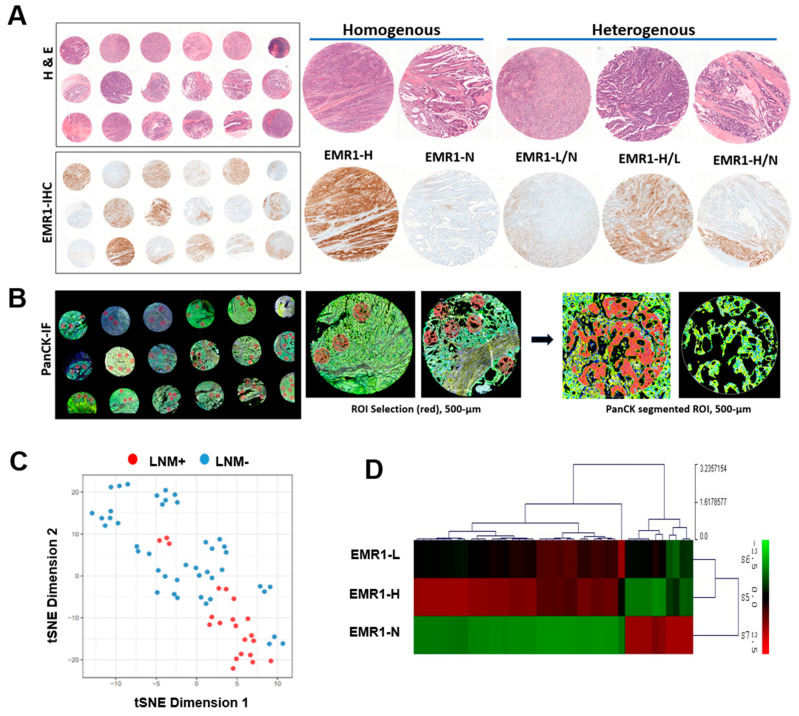
ROI selection and data reduction in the spatial profiling of CC. (A) Hematoxylin and eosin staining and EMR1-IHC staining of the TMA. Representative EMR1 expression pattern (homogenous vs. heterogenous) in IHC staining. (B) ROI selected from PanCK-IF staining based on EMR1-IHC expression for spatial profiling using the NanoString GeoMx digital spatial profiler assay. The morphology markers, PanCK (green, epithelial-cell marker) and Syto13 (blue, nuclear DNA), are indicated. Artificial overlay of tissue segmentation is indicated for each ROI to visualize the PanCK+ (red) segment in an area of 500 µm width (circled). (C) Dimensionality reduction visualization of all ROIs according to overall gene expression profiles based on tSNE. The tSNE plot was annotated by the PanCK segment based on the individual ROI from each CC case, according to LNM (LNM+ vs. LNM−). (D) Molecular profiling of major DEGs in EMR1-H, EMR1-L, and EMR1-N is illustrated as a heat map. Abbreviations: CC: colon cancer, ROI: region of interest, DEG: differentially expressed gene, PanCK: pan Cytokeratin, IHC: immunohistochemistry, IF: immunofluorescence, LNM: lymph node metastasis, H = high, L = low, N = negative, and TMA, tissue microarray.

