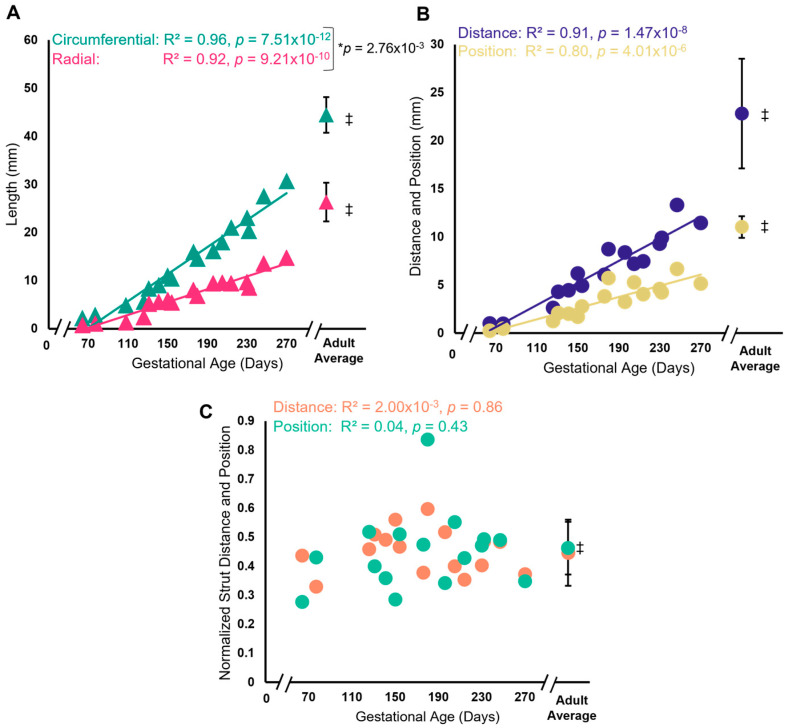
Figure 3.
Despite radial and circumferential expansion of the leaflet over gestation, the normalized strut chordae distance and position remained the same over gestation. (A) Circumferential length of the anterior leaflet (green triangles) and radial length (pink triangles) in mm plotted as a function of gestational age, showing a significant correlation between these variables. * Denotes a significant difference in slope values (p = 0.04) analyzed via analysis of covariance. (B) Distance between the strut chordae (blue circles) and strut chordae position (yellow circles) from the fixed edge of the leaflet in mm plotted as a function of gestational age, showing a significant correlation between these variables. (C) Strut distance normalized to circumferential length (orange circles) and strut position normalized to radial length (green circles) plotted as a function of gestational age, showing no change with gestational age. Each data point represents n = 1 animal. ‡ The average values (±SD, n = 11) from adult animals, taken from Wells et al., 2012 [59] are shown as green triangles (circumferential length), pink triangles (radial length), blue circles (strut distance), yellow circles (strut position), green circles (normalized strut position) and orange circles (normalized strut distance) for comparison to fetal data. Note the axis breaks on all four graphs.

